Cat
From UG
(→Index) |
|||
| Line 6: | Line 6: | ||
== Acc == | == Acc == | ||
| - | |||
== Ops == | == Ops == | ||
| - | |||
| - | |||
| - | |||
| - | |||
| - | |||
| - | |||
| - | |||
| - | |||
| - | |||
=== Freight consolidation === | === Freight consolidation === | ||
| Line 27: | Line 17: | ||
See p 11 of Ghiani book. | See p 11 of Ghiani book. | ||
| - | |||
| - | |||
| - | |||
| - | |||
| - | |||
| - | |||
| - | |||
== Glossary == | == Glossary == | ||
=== A === | === A === | ||
| - | [[ | + | ====Arden Trucking Project==== |
| + | This is an evolving project of supporting Transportation and Supply Chain needs for Arden. Some components that have been added to CT2 for this project: | ||
| + | ** [[:Category:New Arden Trucking Project]] | ||
| + | ** [[:Category:Cybertrax 2.1 Client]] (aka Portal) | ||
| + | ** [[:Category:EDI to TMS]] | ||
=== B === | === B === | ||
| Line 61: | Line 48: | ||
In case of user notifications Dashboard is believed to be a better mechanism (in some cases) than scheduled reports. | In case of user notifications Dashboard is believed to be a better mechanism (in some cases) than scheduled reports. | ||
| - | + | See also [[#Dashboard]] | |
[[File:Dashboard.JPG]] | [[File:Dashboard.JPG]] | ||
| Line 73: | Line 60: | ||
[[#Freight consolidation]] | [[#Freight consolidation]] | ||
| - | + | === FTL === | |
| + | |||
| + | FTL service moves truck directly from its origin to its destination in single trip. | ||
| + | |||
| + | See page 12 of Ghiani book. | ||
=== K === | === K === | ||
| Line 79: | Line 70: | ||
==== KPI ==== | ==== KPI ==== | ||
| - | * (1) | + | * (1) A Performance Indicator or Key Performance Indicator (KPI) is an industry jargon term for a type of Measure of Performance.[1] KPIs are commonly used by an organization to evaluate its success or the success of a particular activity in which it is engaged. Sometimes success is defined in terms of making progress toward strategic goals,[2] but often, success is simply the repeated achievement of some level of operational goal (zero defects, 10/10 customer satisfaction etc.). |
| - | + | ||
| - | + | ||
| + | * (2) in Cybertrax context used to mean [[#Dashboard Report]] | ||
=== L === | === L === | ||
[[#LTL]] | [[#LTL]] | ||
Revision as of 22:40, 16 April 2011
Contents |
Intro
This is CAT (Concepts And Terminology) wiki.
Acc
Ops
Freight consolidation
Three ways:
- facility
- multi-stop
- temporal
See p 11 of Ghiani book.
Glossary
A
Arden Trucking Project
This is an evolving project of supporting Transportation and Supply Chain needs for Arden. Some components that have been added to CT2 for this project:
B
C
D
Dashboard
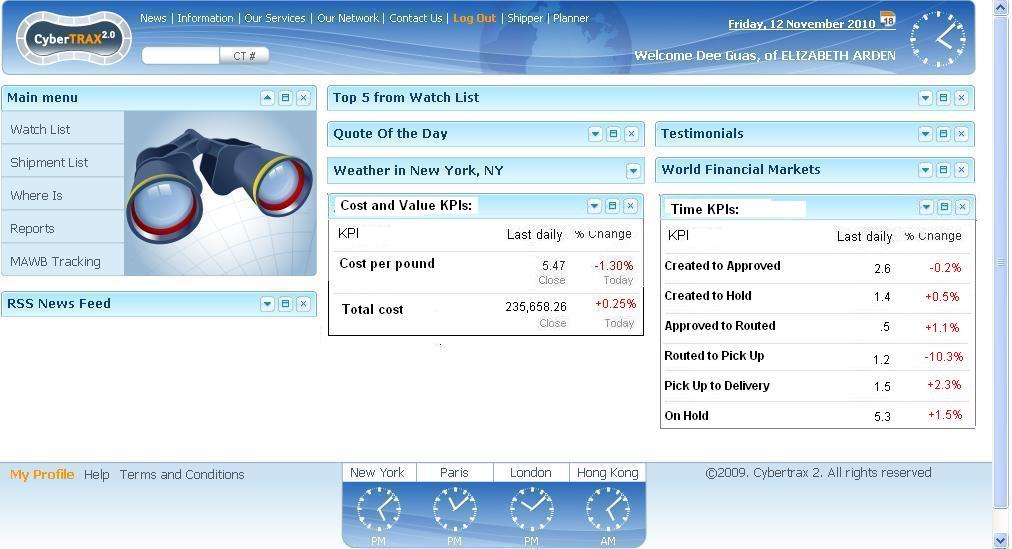
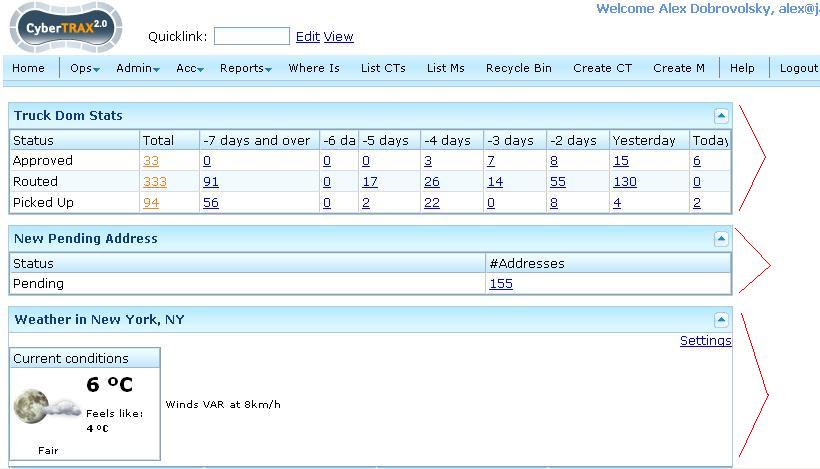
Is a space below main menu on a CT2 Home Page. It is used to post various Panels with valuable information such as "Truck Dom Stats".
Such panels themselves are also often called "Dashboards" or "Dashboard Reports" or "KPIs".
See also: #Dashboard Report, #KPI
Dashboard Report
It is a Panel that represents some aggregated information (often monthly) presented by just one or several numbers almost always with hyper link leading to more detailed report or chart.
See two Figures below. One for Client and one for Internal.
In case of user notifications Dashboard is believed to be a better mechanism (in some cases) than scheduled reports.
See also #Dashboard
E
F
FTL
FTL service moves truck directly from its origin to its destination in single trip.
See page 12 of Ghiani book.
K
KPI
- (1) A Performance Indicator or Key Performance Indicator (KPI) is an industry jargon term for a type of Measure of Performance.[1] KPIs are commonly used by an organization to evaluate its success or the success of a particular activity in which it is engaged. Sometimes success is defined in terms of making progress toward strategic goals,[2] but often, success is simply the repeated achievement of some level of operational goal (zero defects, 10/10 customer satisfaction etc.).
- (2) in Cybertrax context used to mean #Dashboard Report


