TMS Monthly Stats Report
From UG
Info
Mantis: 0003003: [TMS optimization] TMS Monthly Stats (make it art of CT2) 3003
Summary
Elizabeth Arden's supply chain management requires a monthly statistical report of their domestic trucking activities. In addition to their actual figures and numbers, they also require an idea of how or where they can save money within their supply chain. The concept here is to add functionality, which is currently a manual process, into CT2, to automate these high level reports of the monthly domestic trucking statistics.
Business Requirements & Current Business Process
Generate report from the TMS
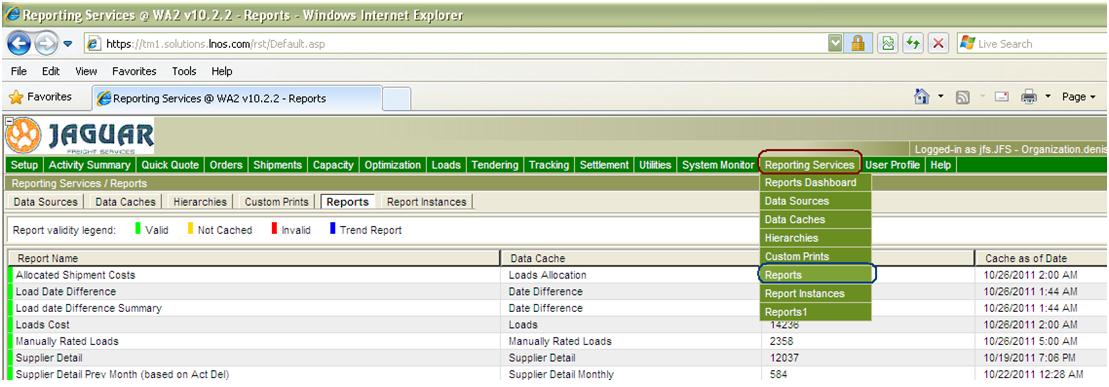
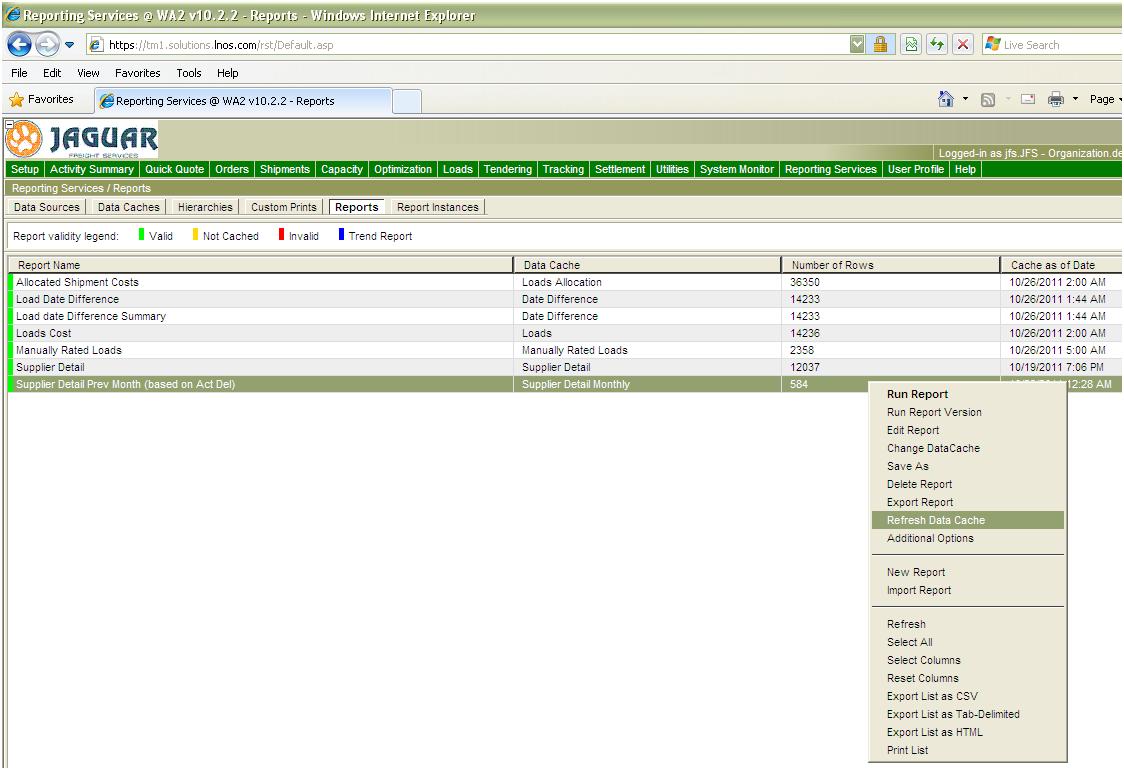
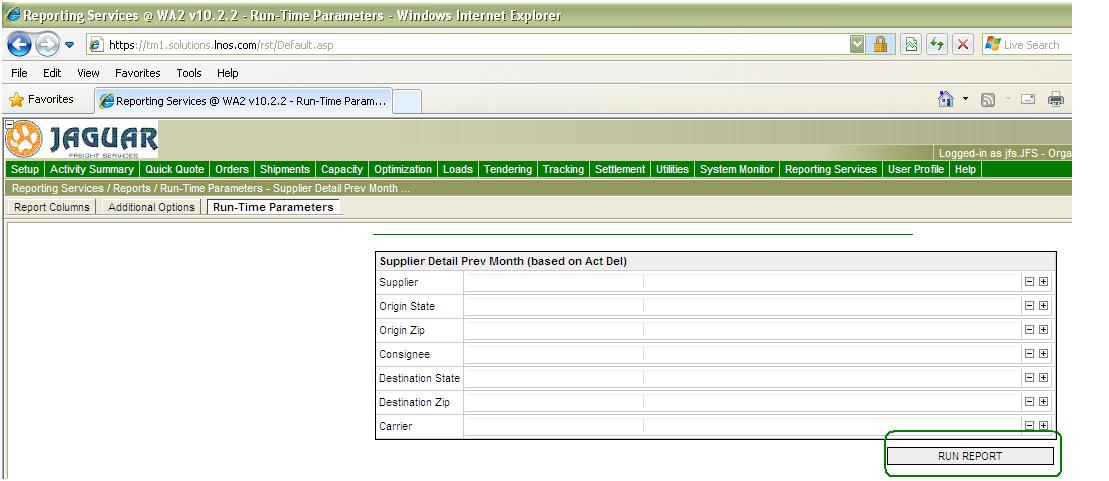
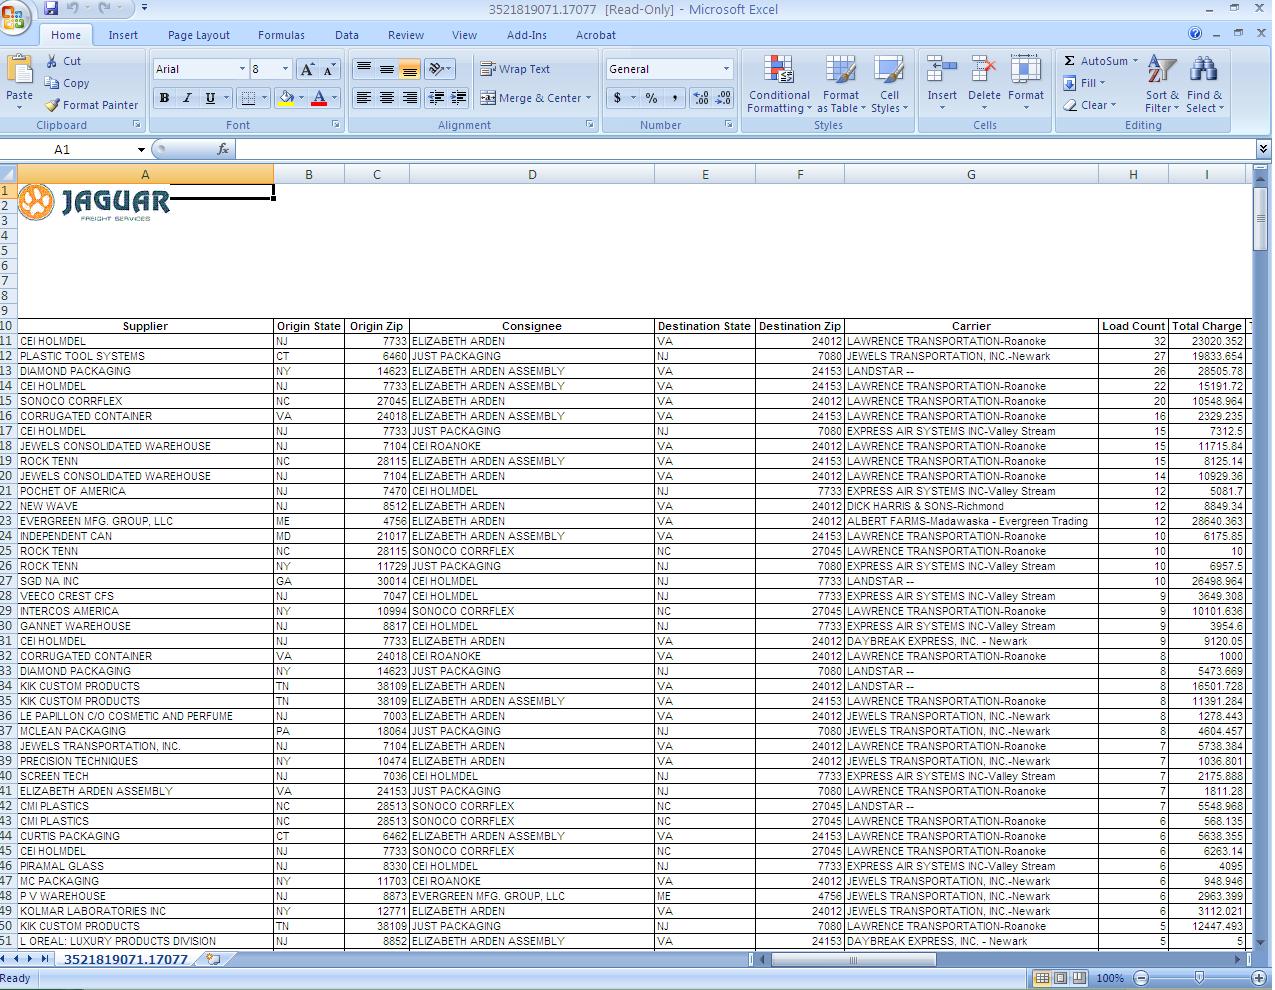
This report is called "Supplier Detail Previous Month". It was built by Descartes according to Marc's/Elizabeth Arden's requirements. The report contains the number of lanes (Origin to destination) covered per month with the totals of their loads, broken down per carrier.
See #Figure_1, #Figure_2, #Figure_3 & #Figure_4
Columns set in the TMS
- Supplier
- Origin State
- Origin Zip
- Consignee
- Destination State
- Destination Zip
- Carrier
- Load Count
- Total Charge
- Total Weight
- Total Pallets
- Total Loose Package
- Avg Weight Per Load
- Avg Pallet Per Load
- Avg Loose Package Per Load
- Lowest Weight Per Load
- Highest Weight Per Load
- Lowest Pallet Per Load
- Highest Pallet Per Load
- Lowest Loose Package Per Load
- Highest Loose Package Per Load
- Cost Per Lb
These columns and their values are used to make up the entire report (workbook) that is given to Elizabeth Arden monthly.
Clean Up Results
1. As this report contains ALL lanes and their totals of loads, it will contain some moves that have total charges of $ 1.00. These need to be removed from the results as ALL $ 1.00 charges are for lanes that the business team does not have rates for when they tender a load to a carrier, as the TM will not allow a load to be tendered unless it is rated.
2. As ALL lanes must be unique, currently we double check the Suppliers Name, Origin Zip, Consignees Name, Destination Zip AND the carrier, as it is possible that the company city name passed from CyberTrax has a either a typo or an abbreviation to the name. For IE: CEI H Holmdel, NJ 07733 & CEI Holmdel Holmdel, NJ 07733 are the same company and the 2 will be listed as separate lanes that would have to be combined.
Separate FTL
From the monthly stats, report on the FTL lanes and find ways to improve on the actual cost per lb by reducing the number of loads per lane. Within the Arden supply chain, the following 5 carriers are full trailer load carriers. These carrier do not handle/move only a few pallets at a time, they actually move full truck loads at a time.
FTL Carriers
- Landstar
- Lawrence Transportation
- Daybreak Express
- Albert Farms
- Dick Harris & Son
FTL Columns
- Supplier
- Origin State
- Origin Zip
- Consignee
- Destination State
- Destination Zip
- Destination Key (this column is added to the report manually and is used for the Consignee Location Tab's Pivot Table Report)
- Carrier
- Activity Type (this is added to the report manually and is used for the Activity Type Tab's Table/Pie Chart Report)
- Load Count
- Total Charge
- Total Weight
- Total Pallets
- Avg Weight Per Load
- Avg Pallet Per Load
- Lowest Weight Per Load
- Highest Weight Per Load
- Lowest Pallet Per Load
- Highest Pallet Per Load
- Cost Per Lb
Separate FTL Savings
Look for ways to improve on the actual cost per lb for the loads that moved with these FTL carrier, for every lane that has 4 or more loads, use the following algorithm to determine if any cost savings.
FTL Savings Columns
- Supplier
- Origin State
- Origin Zip
- Consignee
- Destination State
- Destination Zip
- Carrier
- Load Count
- Total Charge
- Total Weight
- Total Pallets
- Total Loose Package
- Avg Weight Per Load
- Avg Pallet Per Load
- Avg Loose Package Per Load
- Lowest Weight Per Load
- Highest Weight Per Load
- Lowest Pallet Per Load
- Highest Pallet Per Load
- Lowest Loose Package Per Load
- Highest Loose Package Per Load
- Cost Per Lb
- Preliminary Best possible Load Count
- Preliminary Best possible Load Count 1 (rounded up)
- (NEW) Avg Weight per Load with 52 pallets
- (NEW) Avg Weight per Load (re-calc for 45000 lb)
- Best possible Load Count
- Best possible Load Count (rounded up)
- Avg Cost/Load
- Load Count Saved
- Revised Total Charges
- USD amount savings
- Best Possible Cost per LB
FTL Savings Formula
- Calculate Best Possible Load Count:
- Take Total Pallets & divide by 52
- Take Total Weight & divide by the rounded Best Possible Load Count – if greater than 45,000, we have to recalculate as Total Weight divided by 45000 and then use this number, rounded up
- Calculate New Avg Weight:
- Take Total Weight & divide by the Best Possible Load rounded up
- Calculate Avg Cost/Load:
- Take Total Cost & divide by Load Count
- Calculate Load Count Saved:
- Take Load Count & subtract the Best Possible Load rounded up
- Calculate Revised Total Charges:
- Take Avg Cost/Load & multiple by Best Possible Load Count rounded up
- Calculate USD Savings Amount:
- Take Total Charges & subtract the Revised Total Charges
- Calculate Best Possible Cost Per Lb:
- Take the REVISED TOTAL CHARGES & divide by Total Weight
Separate Exceptional FTL
From the monthly stats, look to see if there are any exceptional FTL moves. There are no true definitions used to determine this... These are full truck moves confirmed by Elizabeth Arden without having enough freight inside of the truck to make it a full truck load. IE 3 plts at 1500 lbs can be considered an exception if EA needs this freight ASAP and it is moved on a truck with no other freight; they will also pay the price of a full truck for that move. Although Arden does have a standard for what they consider as FTL, that is followed by the domestic team and when something is out of this range it needs approval to move as FTL from Arden.
FTL Standard
33 pallets or 33,000 lbs
FTL Exceptional Columns
- Supplier
- Origin State
- Origin Zip
- Consignee
- Destination State
- Destination Zip
- Carrier
- Load Count
- Total Charge
- Total Weight
- Total Pallets
- Total Loose Package
- Avg Weight Per Load
- Avg Pallet Per Load
- Avg Loose Package Per Load
- Lowest Weight Per Load
- Highest Weight Per Load
- Lowest Pallet Per Load
- Highest Pallet Per Load
- Lowest Loose Package Per Load
- Highest Loose Package Per Load
- Cost Per Lb
- Best Possible Cost per LB
Exceptional FTL Formula
Separate LTL
From the monthly stats, report on the LTL lanes and find ways to improve on the actual cost per lb by applying a target cost of $ 0.15. Within the Arden supply chain, the following 2 carriers are less than trailer load carriers. These carrier do not handle/move full truck loads worth of freight at a time from 1 origin to 1 destination, they actually collect pallets and cartons from other locations through out their day and deliver to many other locations as well.
LTL Carriers
- Fed-Ex National
- YRC
LTL Columns
- Supplier
- Origin State
- Origin Zip
- Consignee
- Destination State
- Destination Zip
- Destination Key (this column is added to the report manually and is used for the Consignee Location Tab's Pivot Table Report)
- Carrier
- Activity Type (this is added to the report manually and is used for the Activity Type Tab's Table/Pie Chart Report)
- Load Count
- Total Charge
- Total Weight
- Total Pallets
- Avg Weight Per Load
- Avg Pallet Per Load
- Lowest Weight Per Load
- Highest Weight Per Load
- Lowest Pallet Per Load
- Highest Pallet Per Load
- Cost Per Lb
Separate LTL Savings
For the LTL moves, there's a "Target Cost" of $ 0.15 per lb applied to each lane; that if they can achieve this avg price of $0.15, they can save this about of money per lane.
LTL Savings Columns
- Supplier
- Origin State
- Origin Zip
- Consignee
- Destination State
- Destination Zip
- Carrier
- Total Pallets
- Total Loose Package
- Lowest Weight Per Load
- Highest Weight Per Load
- Lowest Pallet Per Load
- Highest Pallet Per Load
- Lowest Loose Package Per Load
- Highest Loose Package Per Load
- Load Count
- Total Charge
- Total Weight
- Avg Weight Per Load
- Cost Per Lb
- Best Possible Cost per LB
- Savings
LTL Savings Formula
- Total Charges - (Total Weight x Target Cost)
- IE Total charges of $ 935.926 - (total weight of 5959 x 0.15 target cost) = $ 42.08 ltl savings
Separate LTL Northbound Savings
From the LTL lanes/carriers, look for all moves that are going from the Southeast (NC, TN, VA, GA.) going to the Northeast (NJ, NY, ME, CT, PA) to find ways to improve on these actual cost per lb by applying a target cost.
Northbound Savings Columns
- Supplier
- Origin State
- Origin Zip
- Consignee
- Destination State
- Destination Zip
- Destination Key (this column is added to the report manually and is used for the Consignee Location Tab's Pivot Table Report)
- Carrier
- Activity Type (this is added to the report manually and is used for the Activity Type Tab's Table/Pie Chart Report)
- Load Count
- Total Charge
- Total Weight
- Total Pallets
- Avg Weight Per Load
- Avg Pallet Per Load
- Lowest Weight Per Load
- Highest Weight Per Load
- Lowest Pallet Per Load
- Highest Pallet Per Load
- Cost Per Lb
- Target Cost Per LB
- Savings
Northbound Savings Formula
Separate Tri-State
From the monthly stats, report on the "Tri-State" LTL lanes; within the Arden supply chain, there are two carriers that handle the majority of the Tri-State pickups and deliveries. These carriers can handle both LTL & FTL moves, depending upon the amount of freight moving from one destination to another.
Tri-State Carriers
- Jewels Transportation
- Express Air
Tri-State Columns
- Supplier
- Origin State
- Origin Zip
- Consignee
- Destination State
- Destination Zip
- Destination Key
- Carrier
- Activity Type
- Load Count
- Total Charge
- Total Weight
- Total Pallets
- Avg Weight Per Load
- Avg Pallet Per Load
- Lowest Weight Per Load
- Highest Weight Per Load
- Lowest Pallet Per Load
- Highest Pallet Per Load
- Cost Per Lb
Separate Tri-State Potential Savings
Look for ways to improve on the actual cost per lb for the loads that moved with these Tri-State carriers, for every lane that has 4 or more loads, use the following algorithm to determine if any cost savings.
Tri-State Savings Columns
- Supplier
- Origin State
- Origin Zip
- Consignee
- Destination State
- Destination Zip
- Destination Key
- Carrier
- Activity Type
- Load Count
- Total Charge
- Total Weight
- Total Pallets
- Avg Weight Per Load
- Avg Pallet Per Load
- Lowest Weight Per Load
- Highest Weight Per Load
- Lowest Pallet Per Load
- Highest Pallet Per Load
- Cost Per Lb
- Best Cost Per Lb
- Revised Load Count
- Revised Weight Per Load
- Revised Total Charge
- Savings
Tri-State Savings Formula
- Calculate Best Cost Per Lb:
- Take the REVISED TOTAL CHARGES & divide by Total Weight
- Calculate Revised Load Count:
- Take Total Weight & divide by the Revised Weight Per Load
- Calculate Revised Weight per Load:
- Take Total Weight & divide by the Revised Load Count
- Calculate Revised Pallets per Load:
- Take the Total Pallets & divided by Revised Load Count
- Calculate Revised Total Charges:
- X & multiple by revised Load Count X = 822.95
- Calculate Savings:
- Take the Total Charges & subtract the Revised Total Charges
Separate Small Package
From the stats report on all of the small package shipments; within the Arden supply chain there is only one small package carrier.
Small Package Carriers
- Fed-Ex Small Package
Small Package Columns
- Supplier
- Origin State
- Origin Zip
- Consignee
- Destination State
- Destination Zip
- Destination Key
- Carrier
- Activity Type
- Load Count
- Total Charge
- Total Weight
- Total Pallets
- Avg Weight Per Load
- Avg Pallet Per Load
- Lowest Weight Per Load
- Highest Weight Per Load
- Lowest Pallet Per Load
- Highest Pallet Per Load
- Cost Per Lb


