KPI
From UG
Contents
|
Info
Mantis:
- parent: 0003545
- category: DR/KPI:ph1
Team:
- Sponsor: Simon
- UAT/Prod Manager: Marc
- Lead SA/PM/SIT: Alex
- Lead Dev1: Sasha
- Dev2: Kostya
- Graphics: Vic
- QA: Roma
Email groups:
alex@jaguarfreight.com; a.pivniak@elcosol.com; k.ushakov@elcosol.com; v.makhankov@elcosol.com; r.lakhno@elcosol.com;
Requirements
- This Phase One should include first portion of DRs/KPIs delivered
- Must be production quality
- This phase is for Arden primarily (all MOTs) but also for Sales Dept to show possibilities to prospects and existing Clients
- This project is very important top visibility project
- Also right tool/lib should be evaluated/selected for the future (example: LogiXML vs ZK API/other Java APIs)
- Due dates:
- production - end of June
- vendor/libs evaluation - end of May
Solution
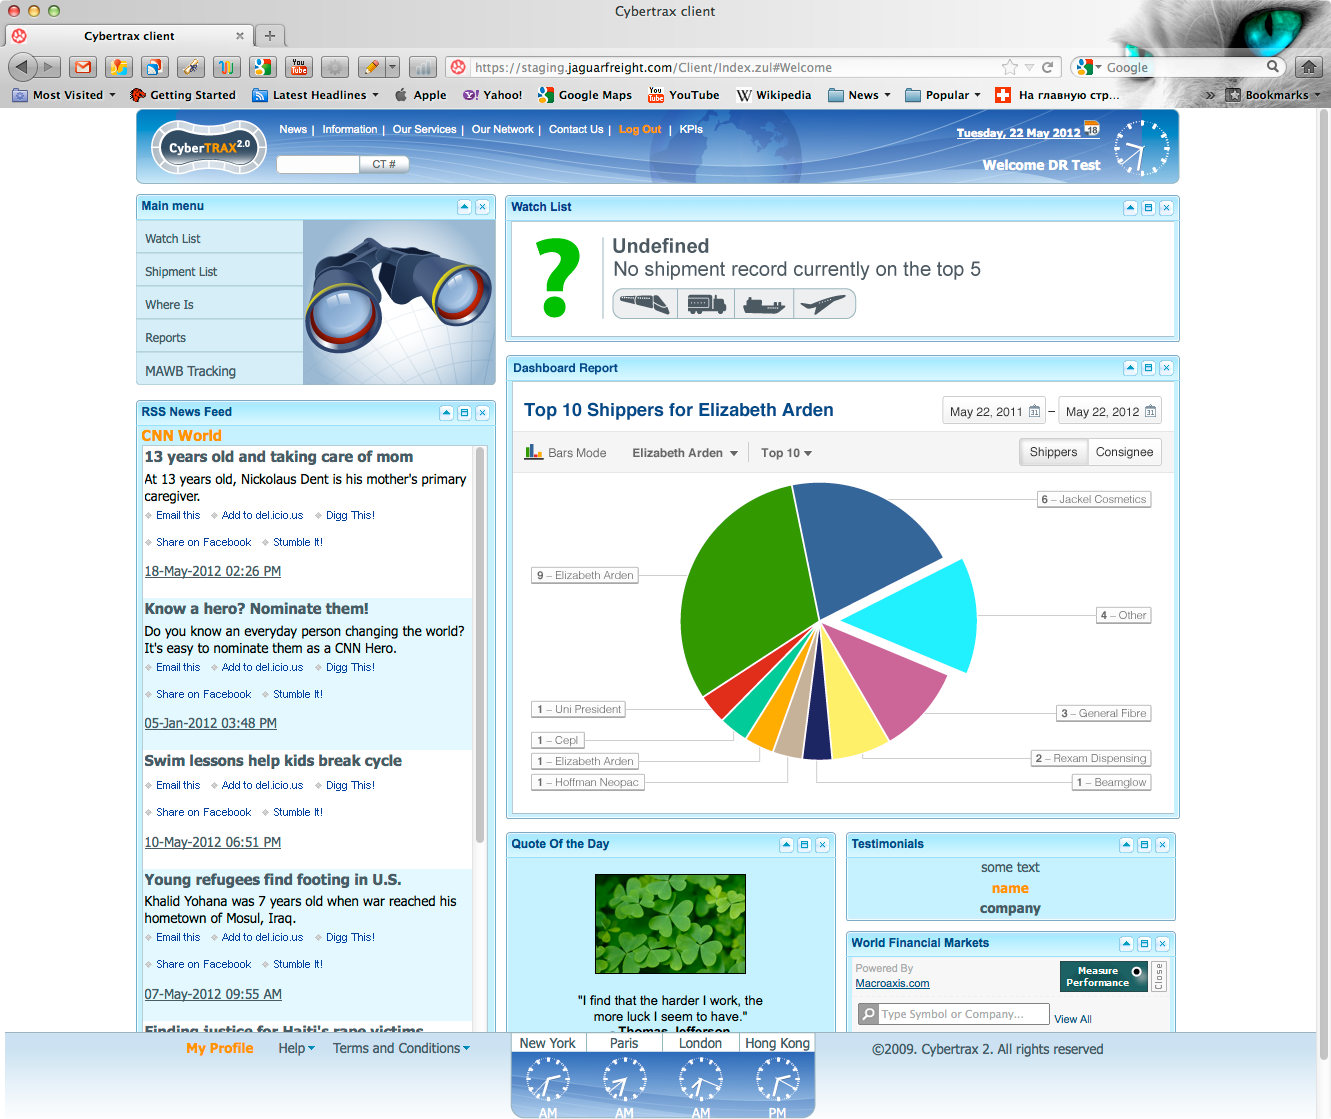
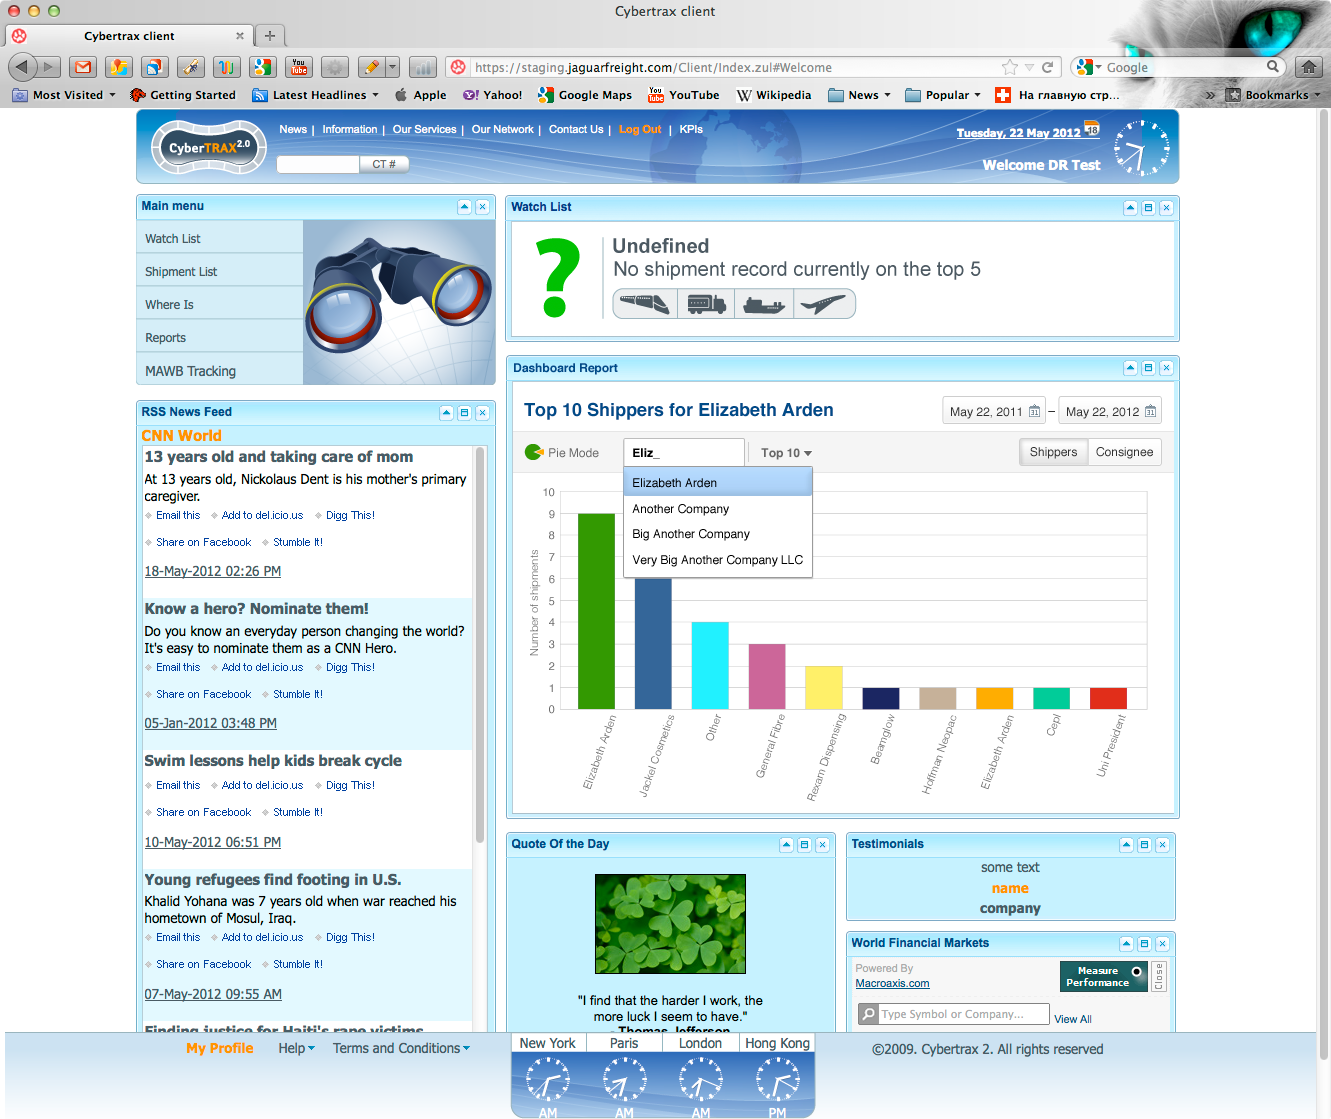
DR1 Simple Shipment count DR
- See mock-up below
- Title: Top Shippers / Consignees
- Location: this DR should appear on homepage
- Axis X: display Shippers or Consignees plus "Others"
- display largest to smallest (left to right)
- Axis Y: shipment count
- Bars vs Charts - two displays to be supported, need selector to switch between two
- Client Company filter:
- single select
- if on internal then show all E0;
- if on Client show list of E0s after visibility rules are applied
- Year: timeframe filter. Use CT Created On date to associate CT with the year
- Shippers vs Consignees selector: group by indicator
- Top X selector:
- controls in how many groups to separate shipments
- one additional group is always "Others"
- default value is to be managed through User Admin on internal
- max choice= 10
DR1 Graphics and UI mock up
!!!! Status Note: below version is not final and has some errors !!!
Pie chart example:
Bar chart example:
DR2 Complex Shipment Data per Client per Year DR, PART A
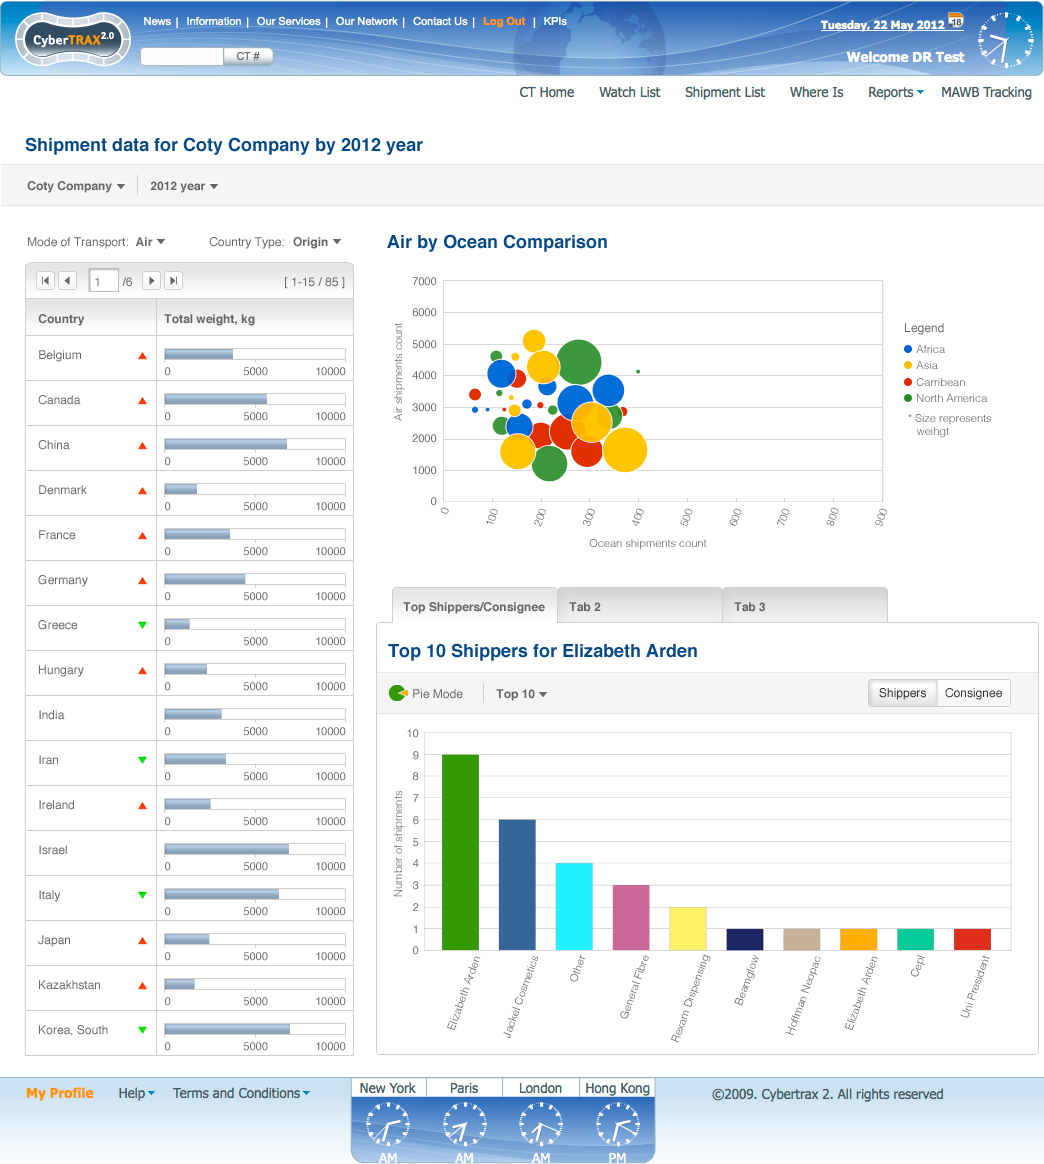
DR2 Mock Up
!!!! Status Note: below version is not final and has some errors !!!
Original outdated version see here: File:DR2.JPG
DR2 General Info
This DR consists of:
- Title : "Shipment data by Year and by Geography"
- #DR2 Main menu (at the top)
- #DR2 Left panel
- #DR2 Top Right panel
- #DR2 Bottom Right panel
DR2 Main menu
- Client Company:
- single select
- if on internal then show all E0;
- if on Client show list of E0s after visibility rules are applied
- Year': timeframe, use CT Created On date to associate CT with the year
- MOT: options see below
- Air
- Ocean (combine all ocean modes LCL, FCL(AW), FCL(MLB))
- Country type: options - see below
- Origin - (use country in Shipper)
- Destination - (use country in Consignee)
DR2 Left panel
- two column table sorted by country alphabetically
- left column: countries that correspond to origin/dest countries - selection in the main menu
- right column: corresponding total weight of all CTs for particular country
- max (now shows 10,000 on mock up) - design option: use appropriate scale based on max value for data available
- red/green arrow
- this indicates change from previous year (red - up; green - down)
- if data for previous year is unavailable then no arrow
- country region indicators
- color of the dot indicates what region they belong to
- paging
DR2 Top Right panel
DR2 Air by Ocean comparison table
- Title: Air by Ocean comparison table
- Axis X: ocean shipments count
- Axis Y: air shipments count
- Plotted data:
- each dot corresponds to one Region
- color of the dot indicates what Region is it as defined on Legend
- size of the dot is proportional to the total weight of the CTs for given Region
- Regions - as defined in CT2 DB - see below:
- if easy to implement show only regions that have data
- Legend: indicates unique color per Region
Africa s
Antarctica s
Asia m
Australia and New Zealand s
Caribbean s
Eastern Europe & Russia s
Greater China b
Middle East b
North America b
South America m
Western Europe b
this is note for Vic: in your mock-up example use this typical distribution: b - big, m - medium, s - small
DR2 Bottom Right panel
This is a multi tab panel. Some tabs are defined under Part B (another section).
DR2 Tab1 Top Shippers, Consignees
Re-use #DR1 Simple Shipment count DR
Please note that in this case we do not need these filters displayed on the panel (since thes values are selected in Main Menu):
- time frame
- E0 Client Company
Also in this case more filters would be applied (see main menu):
- MOT
- country type
DR2 Misc
- DR2 should appear as "standard ZK panel" (on "KPI Dashboard" page - see "KPIs" link in top menu on Client App).
- DR2 should be available as option in User Admin on internal App (on/off).
DR2 Complex Shipment Data per Client per Year DR, PART B
DR2 Tab2
TBD
DR2 Tab3
TBD
Work breakdown structure and Change Requests
Sequence
- first 3567, 3575 in parallel
- next 0003583
- next 0003595
3567 DR1 Simple Shipment count DR
- Sasha: Java/SQL
Spec: #DR1 Simple Shipment count DR
3575 Evaluate LogiXML
- Kostya, Vlad
0003583 DR2 Complex Shipment Data per Client per Year DR, PART A
- kostya: SQL, Java b-end
- sasha: b-end, f-end
spec: #DR2 Complex Shipment Data per Client per Year DR, PART A
0003595 Complex Shipment Data per Client per Year DR, PART B
spec: #DR2 Complex Shipment Data per Client per Year DR, PART B
Timeline Milestones Deadlines
- May 20:
- project STARTED
- Monday May 28, 9am EST:
- 3567 DR1 : dev/QA completed and moved to SIT
- Monday May 28, 11 am EST:
- 3567 DR1 : SIT completed and moved to UAT (demo to Marc)
- Friday June 1, 9am EST:
- 0003583 DR2 part A: dev/QA completed and moved to SIT
- TBD
- TBD
- June 30, Sat
- project END


