Estimated P and L based on history
From UG
Contents |
Info
- parent: 0002515 [Estim P&L / Accruals] .......<parent>
Glossary
Requirements
Requirements Submitted by MO
Objective: Gain some visibility into the organization’s financial result, while we wait for an automated, exact and integrated solution (feed from cost and vendor rate database)
The proposal is to estimate costs and revenues on a per shipment basis, utilizing historical information from Cybertrax.
The requirement would be for Cybertrax to generate daily “statistics” compiling a total cost and revenue figure, per container (FCL), cubic meter (LCL), or chargeable KG (air).
The above for shipments ‘closed’ in Cybertrax according to the new 2012 GM Split and related file closing guidelines.
New shipments, upon confirmation of an actual departure date, would populate an estimated P&L based on historical information, based on the following:
1.	Client
2.	Mode
3.	Origin
4.	Destination
In the absence of a previous record for this client, the shipment would look for an identical country to country pairing in Cybertrax. This estimate would get a 80% rating.
In the absence of historical data for the specific country to country pairing the estimated P&L would not populate.
A dashboard report showing records with an actual departure date, and no estimated P&L, can also be implemented.
Requirements Analysis
Proposal
Concept
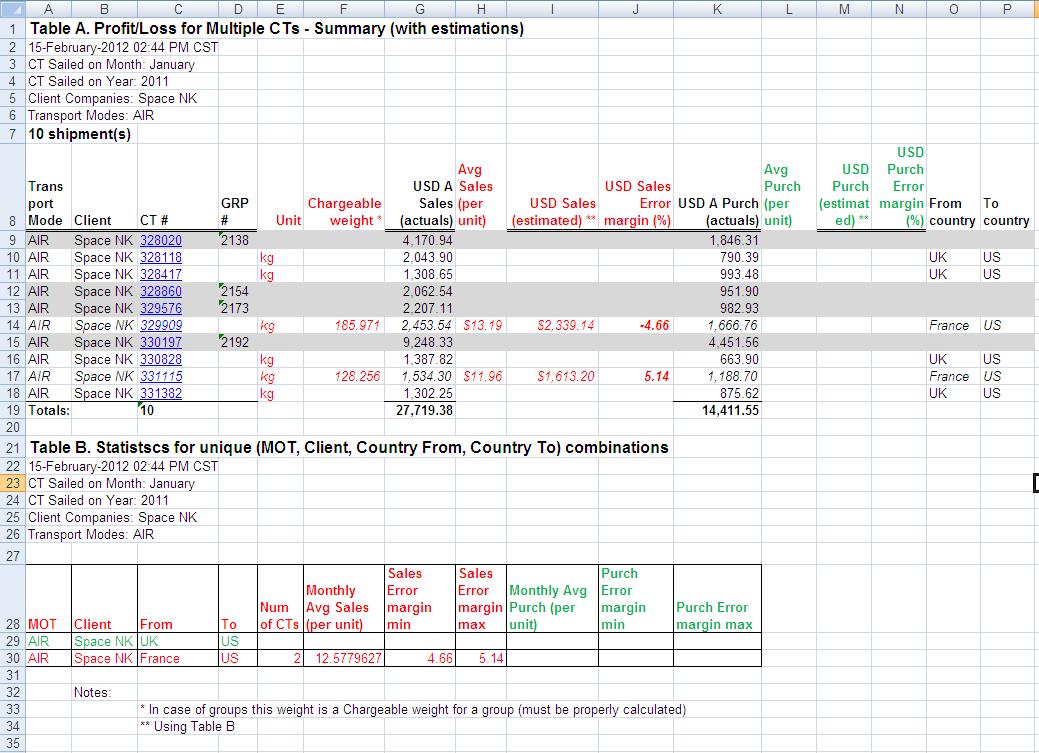
One can imagine that at the center of this module are two tables:
- one contains average rates for specific unique (MOT, Client, From, To) combination calculated based on records:
- that are closed; see definition here: Profit_Sharing_Module#Closing_time_frames
- comparatively recent (let's say closed within last 12 months). Including earlier records would not be feasible due outdated rates. (table A)
- another table contains shipments with estimated rates (based on table B), and margin of error (for records that are already closed (table B)
See example below (this xls contains formulas and attached to parent mantis).
Examples provided for Sales (in red). Examples for purchase/cost (in green) are not provided but they have to follow same logic as sales.
Example is based on one month data. In reality Table B would be based on 12 month of most recent data. And Table A would show any desired time frame. Again most probably up to most recent 12 month. As far as filters - most typical would be - per client, per time frame.
Phases
I suggest to create solution for MOT Air first.
Also before incorporating functionality into the system do #Feasibility study that assumes generating "ad hoc" reports.
Feasibility study
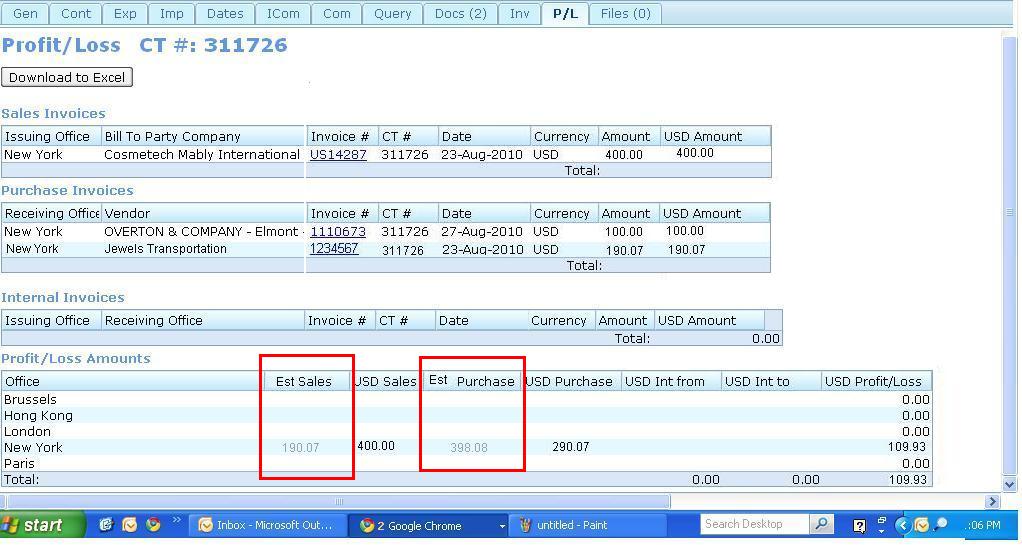
Add option to P n L report
See Table A on Figure under #Concept.
Add option to P n L tab
Possible layout:
Dashboard report
Report CTs that have no estimation due to absence of appropriate (MOT, Client, Country From, Country To) combination in the system.
Report it as a DB/KPI report.
Design for levels 1,2,3 could be standard (counter - filters - shipment level).
SOW 1
TBD


