KPI Business Requirements & Software Requirements Specification
From UG
(→3567 Rapidly Create #Simple Shipment count DR using just ZK libs / java libs) |
(→BR3 [Date-based KPIs]) |
||
| Line 436: | Line 436: | ||
* Shipment Custom Clearance on Date | * Shipment Custom Clearance on Date | ||
* Shipment Delivery on Date | * Shipment Delivery on Date | ||
| + | * Shipment On time performance | ||
* Universal list of date based KPIs for all modes | * Universal list of date based KPIs for all modes | ||
| Line 497: | Line 498: | ||
:* 29) '''Custom Clearance To Delivery on Date''' = Delivery on Date - Custom Clearance on Date | :* 29) '''Custom Clearance To Delivery on Date''' = Delivery on Date - Custom Clearance on Date | ||
:** Number of days since the date of custom clearance the shipment until the date of its delivery | :** Number of days since the date of custom clearance the shipment until the date of its delivery | ||
| + | :* 30) '''On Time Performance''' | ||
==== Define key parameters ==== | ==== Define key parameters ==== | ||
Current revision as of 16:56, 12 July 2012
[edit] Mantis
<Mantis Number(s) & Link>
[edit] Project Overview
[edit] Business Objective(s)
Key Performance Indicators (KPIs) are valuable metrics that clients and Jaguar Freight Services (JFS) can utilize to improve their supply chain management operations. These metrics report on cost performance, cycle time performance, load utilization performance, etc.. Examples include cost per pound, cycle time between shipment creation to approval, etc.. There are an infinite number of possibilities for what one might consider a KPI. It is up to the client and/or JFS management team to utilize these KPIs to identify weak areas of their operations and to develop strategic corrective action plans to improve logistics performance.
The objective of the CyberTrax2 KPI project is to provide an easy to use, intuitive, interactive, scalable, and flexible interface for both internal JFS management and external client users to view and report on KPIs. It is absolutely imperative that the accuracy and mechanics of KPIs are well understood by all.
KPIs will be offered as a fee-based service to external clients. Current fee structure has yet to be finalized, but the application must be able to easily accomodate any fee-structure that is imposed by business executives.
[edit] High Level Project Deliverables
- Download to Excel
- KPI Dashboard
- KPI Admin (user administration)
- KPI Editor (customizable Dashboard editor)
- Evaluate Business Intelligence software vendors (Build vs. Buy)
- Internal KPI(s) [for internal Jaguar management]
[edit] Project Stakeholders & Roles
- Simon Kaye - CEO - Project Sponsor
- Marc Selter - VP - Product Manager
- Alex Dobrovolsky - Director of Technology - Solutions Architect
- Montira Renfrew - CT2 Systems Analyst
- Mihail Tymoshenko - CT2 Software Developer (Elcosol)
- Denise Guastella - CT2 Support Manager
- Kostiantyn Ushakov - CEO/CTO Elcosol
- Perry Lee - CT2 Project Manager
[edit] Project Scope
The below items are in-scope for this KPI project:
- Design and implement a scalable KPI module that will satisfy all future KPI requirements for at least the next 3 years.
- Design must take into consideration future KPIs requirements (Mobile, International, External Interfaces [Google Maps], etc..)
- Fill in existing gaps (functional & non-functional) in existing cost-based KPI module.
- Design and Implement a KPI module for both Internal CT2 and Client CT2 applications.
- Implement below KPIs
- Cost-Based KPIs
- Date-based KPIs
- Lane Optimization KPIs
- Counter/Aggregated KPIs
- Ability to overlap & report on multiple KPIs.
- Design and implement an entitlements management module to administer KPI-based entitlements.
The below items are out-of-scope for this KPI project:
- Address performance issues with any CT2 module outside of KPI.
- Merge Internal CT2 and Client CT2 applications.
- Mobile KPI
[edit] Project Dependencies
- Validations for complete data elements (dates, countries, cost) must be in place and verified prior to delivering KPI.
[edit] High-Level Timelines
This project will be delivered in phases.
| Phase | Start | Complete | |
|---|---|---|---|
| Phase I - Batch Scheduling System (to be confirmed), KPI Dashboard, Download to Excel | Requirements | ||
| Design | |||
| Construction | |||
| Verification | |||
| Maintenance | |||
| Phase II - KPI Editor, KPI Admin | Requirements | ||
| Design | |||
| Construction | |||
| Verification | |||
| Maintenance | |||
[edit] Risks
<Identify internal and external risks to the project: schedule, resources, technical, business, cost, market conditions, external vendors/partners, etc..>
[edit] Assumptions / Constraints
Assumptions
- The KPI module will not require significant redeisgn within the next 3 years.
- Critical resources (0.5 FTE Analyst and 1 FTE Developer) will be fully allocated to this project for its entire duration.
- All major requirements would have been identified during the requirements/design phase of this project. Any requirements identified post design-phase will have minimal impact on project schedule and scope.
- Project Team will document & provide walk-through of entire KPI design prior to construction. All project documents will be signed off prior to construction.
- QA resource will be fully allocated to this project during verification phase(s).
- Business unit will have adequate resources to perform UAT during verification phase(s).
- All non-working periods (personal vacations, holidays, etc..) will be baked into project plan.
- All resources will have adequate knowledge of business & technology to fulfill their roles & responsibilities with minimal training.
- All KPI related data in CyberTrax must be accurate and complete (ie.. origin/consignee countries, complete P/L, currency conversion rules, etc..)
- All country to region mappings will be accurate and complete in CT2.
Constraints
- KPI module must not negatively impact the current performance of CyberTrax2.
- All in-scope KPIs must be delivered and fully functional by end of year 2012.
- Entire KPI project must be delivered with existing resources.
- A production ready KPI dashboard must be delivered by end of Q2 2012.
[edit] Business Intelligence Software Provider Requirements
[edit] Requirements
- Ability to integrate and embed system into CT2
- Embed directly into CT2
- Offer as white label service with SSO interface
- Data accessibility based on user entitlements - client based filtering
- Ease of integration & ETL (Extract-Transform-Load)
- Integrate < 6 months
- Supported database platforms = MySQL
[edit] Vendors
- Prognoz
- Development/Consultancy/Advisory firm.
- LogiXML
- JReports
- JReport Server(2 Prod cores) - $27k
- JReport Server (2 non-prod cores) - $10k
- 2x JReports Designer - $3,000
- Annual Maintenance: $8k
- JasperSoft / JasperReports (open source)
- $31k/ 4 core /year - subscription license
- Pentaho
- Direct Sell unlimited user base - 8 cores = $80,000 annual
- Emanio
- 75k License Fee (annual maintenance: 15k)
- 5k (annual maintenance: 1k) Admin user license
- 1,200 per user (5 user min)
[edit] Business Requirements
<List each business requirement under a separate heading. Also include process flows (UML, Sequence Diagrams, Swimlane, Flow chart, etc..) as applicable>
[edit] BR1 [Core KPI Foundation]
[edit] BR1.1 [Overlapping KPIs]
- Need object reports/KPIs/Widgets to be available for Internal and External users
- Need special page (dashboard) with various panels
- Need flexible admin to manage dashboard on the System, Manager, and User levels
- Need ability for user to manage/organize their own widgets, panels, reports on their dashboard
- Need ability for user to manage multiple dashboards
- Need ability to manage specific information on chart and download to excel
- Need ability to define and add list of other KPI's which can be overlapped with current (depends from key entity)
- Need common filters for all KPIs
- Need Client Visibility rules for external users roles
- Need persistence (system must remember last state of dashboard for individual user to reproduce at the next login)
[edit] GLOSSARY
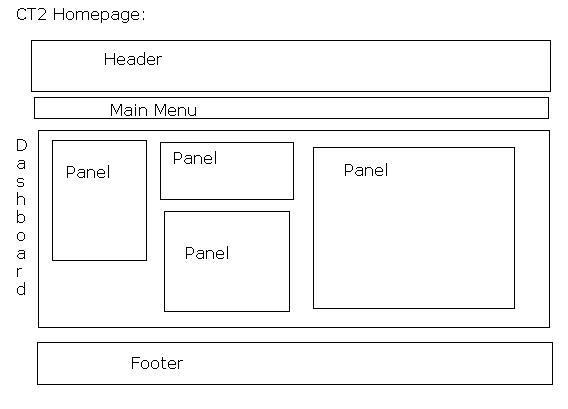
Dashboard - it is a space between Header/Main Menu and Footer on a CT 2 Home page(refer to both Client and Internal Applications - slowly merging to one application). It contains various Panels ("widgets") with valuable information such as "Weather", "RSS News feeds", "Cost and Value KPIs", "Reports Dashboard Panel", "Truck Dom Stats Dashboard Report", ...etc.
- Dashboard framework provides displaying of specific widgets on Dashboard area (Dashboard) of CT 2 Home Page only.
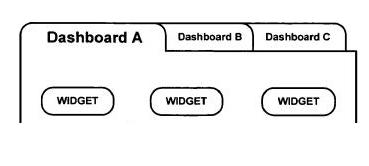
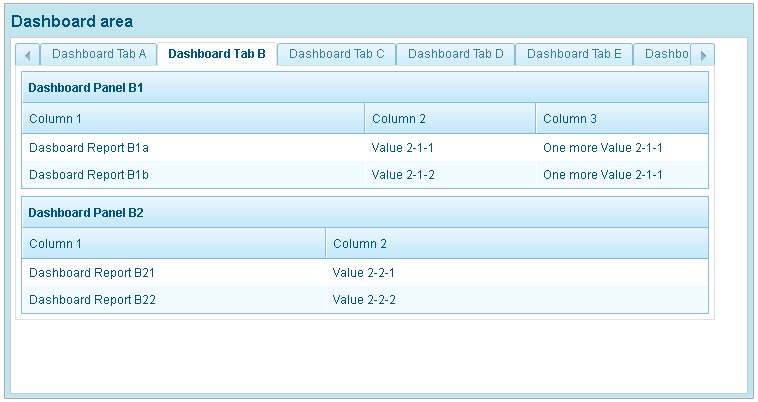
- Dashboard area contains specific dashboard tabs (#Multiple dashboards) with sets of dashboard panels.
- Each dashboard panel reflects specific widget with valuable information.
- Dashboard area contains specific dashboard tabs (#Multiple dashboards) with sets of dashboard panels.
Widgets - it is an element of a graphical user interface that displays an information arrangement and provides standardized data manipulation.
- Widgets in CT2 can be divided on following groups:
- Informer - Actual information from external sources. Examples: RSS News Feed, World Financial Markets,... etc.
- Dashboard Reports - Summarized information calculated from CT2 DB. Examples: Truck Dom Stats, Scheduled Reports, Estimated GM,...etc.
Panels - it is widget
Chart - it is a graphical representation of data, in which "the data is represented by symbols, such as bars in a bar chart, lines in a line chart, or slices in a pie chart". Charts are often used to ease understanding of large quantities of data and the relationships between parts of the data. Charts can usually be read more quickly than the raw data that they are produced from. Certain types of charts are more useful for presenting a given data set than others. For example, data that presents percentages in different groups are often displayed in a pie chart, but may be more easily understood when presented in a horizontal bar chart.On the other hand, data that represents numbers that change over a period of time might be best shown as a line chart.
Reference: "Cary Jensen, Loy Anderson (1992). Harvard graphics 3. http://en.wikipedia.org/wiki/Chart" [Accessed 04/11/2012]
DR KPI Level 1 - it is a table of averaged KPI value (one or more) per specified time frame.
- Time frame for KPI calculating set on KPI settings tab in My Profile section.
DR KPI Level 2 - it is a chart of one KPI that reflects averaged value of KPI's amount in relationship to certain parameter(s).
- Level 2 consists of 3 sections: Parameters, Chart, Filters
DR KPI Level 3 - it is a spreadsheet of averaged KPI value (one or more) per specified time frame and specified output result.
- Level 3 consists of Download to Excel functionality
[edit] ADMIN
- Create special page with various panels with ability to add additional page(s) to organize the layout of panels (Dashboard)
- Provide ability to create additional page(s)
- Provide ability to name/edit/remove each dashboard page
- Provide ability to group panels to each dashboard (organize panels for each dashboard available from the default panels setting on the dashboard)
- Provide ability to move the order of each dashboard tab
- Provide ability to drag/drop panel(s) to each dashboard
- Create admin level to manage dashboard and panels across CT2 Home for both Internal and External users.
- Consist of 3 levels of admin functionality:
- System Level
- Admin Level
- User Level
- Consist of 3 levels of admin functionality:
[edit] System Level
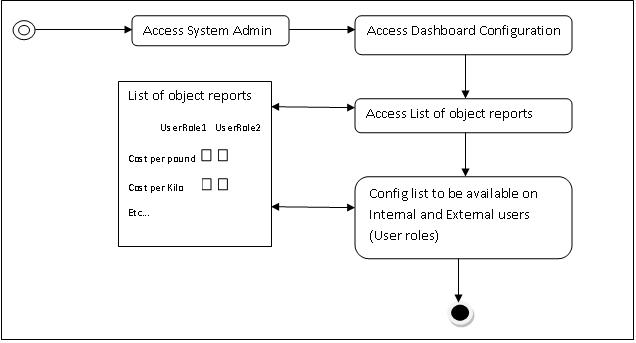
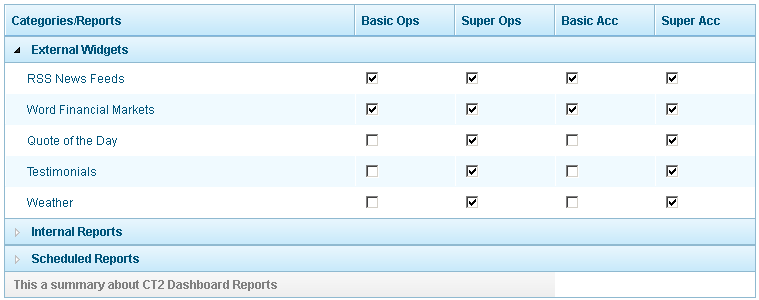
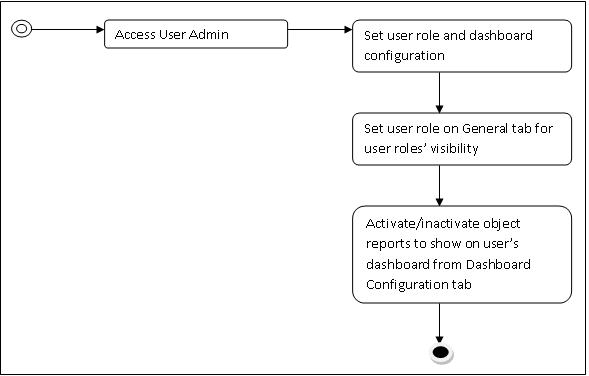
What: System level activates reports for whole system for user roles
- Need flexible admin to manage dashboard from System level to configure default setting for External and Internal users on CT2 Home
- To keep list of all existing object reports and future object reports(widgets, reports, KPIs..etc) to be available for both External and Internal users
- To be able to activate object reports in the system
- To set default parameters of object reports
- To group and categorize object reports to:
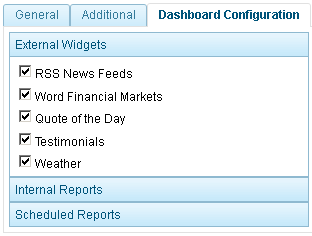
- External Widgets - such as RSS News Feeds, Word Financial Markets, Quote of the Day, Testimonials, Weather...etc
- Internal Reports - such as Truck Dom Stats, New Pending Address, QB Dashboard panel, Estimated Gross Margin panel, Profit sharing Panel,...etc
- KPIs - such as Cost per pound, Cost per kilogram, ...etc
- Scheduled Reports - such as daily report, in-transit report, ...etc
[edit] Admin Level
What: Admin Level gives permissions to current user to use reports selected from list
- Need flexible admin to manage dashboard from Admin level to configure user profile
- To manage activated/inactivated panels
- To show list of all activated panels for External and Internal users
- To activate panel(s) for certain user (user role)
[edit] User Level
What: User Level provides user's abilities for managing panels and assigning reports to panels
- Need flexible user admin level "My Profile" for personal setting
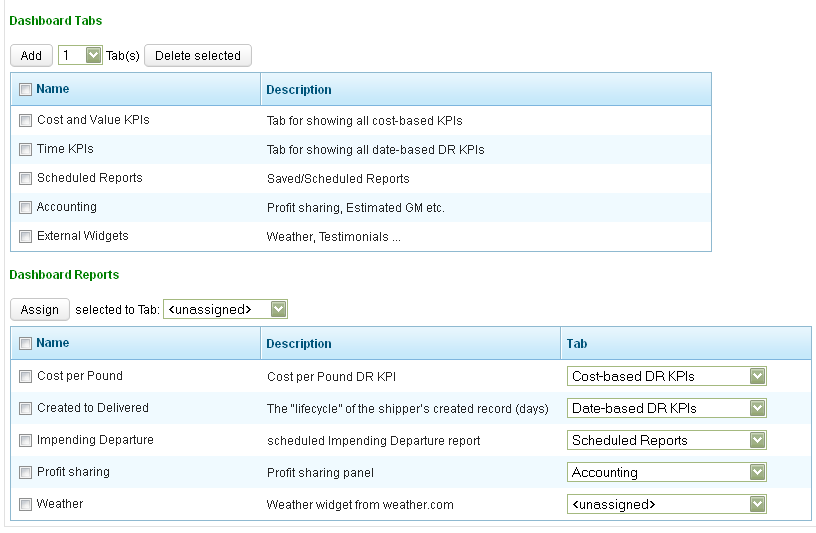
- To allow user to manage their own custom setting to activate/deactivate each panel and layout for panels on dashboard(s)
- Solution for current state
- Client and Internal applications are separated. Internal Application does not have "My Profile". This functionality should be added on the Internal application as same as Client application.
- "My Profile" should be built consistent way in order to reuse once two applications are merging
- Solution for future state
- Merging Internal application to Client application to be only one application. This is related to I-portal. It is a dependency project.
- Solution for current state
- To remember user last setting state of panel(s) on dashboard(s) for each individual user
- To use available functionality to custom organize panels and dashboards
- Ability to manage and create any number of additional dashboard tabs and name/edit/remove them arbitrary
- See functionality and mock up 1 for #Adding dashboard tab
- See functionality and mock up 2 for #Naming and editing tab's name
- See functionality and mock up 3 for #Removing tab (reminder note: Validation/constraint and action should be listed)
- Ability to assign any available panel(s) to any specific dashboard tab
- Ability to activate/deactivate panels from the available list of panels to display it on dashboard and assign selected panel to specific tabe of dashboard where to be displayed
- Ability to set custom parameters for value display on each panel
- NOTE: Default setting - all panels on "Main Dashboard" tab.
- Ability to manage and create any number of additional dashboard tabs and name/edit/remove them arbitrary
- To allow user to manage their own custom setting to activate/deactivate each panel and layout for panels on dashboard(s)
File:MyProfileADD.JPG
[edit] KPIs
Common Requirements for adding new KPI
To simplify further process of adding new KPI in CyberTrax we suggest use unified procedure of defining KPI.
- STEP 1. MO requests a new KPI and provides information for analysis.
- STEP 2. BA prepares information for development as list of key parameters:
- Key entity. Base of KPI or that for which the KPI is calculated.
- Example: shipment (for CT-based KPI), load (for Load-based KPI), user (for User-based KPI), trucker (for Trucker-based KPI).
- KPI function. Formula to calculate KPI. Result is always a number (integer or real).
- Should be shown on Axis Y in its own measure unit.
- Example: cost per pound/lane, created to approved/rejected/delivered.
- KPI measure unit. Name of units in which the KPI is to be measured.
- Example: USD (Cost and value KPIs), Day (Date KPIs).
- Key Date rule. Points or expression for key events of KPI (created, approved, delivered etc).
- Mostly depends from KPI family (cost, date) or KPI base (key entity).
- Example: Created on Date, Approved Date, Actual/Estimated Delivery Date.
- "Group By" methods. List of categories which can be used for grouping of KPI on Chart.
- Will be shown on Axis X.
- Each KPI has its own set of group by (default + specific).
- Should correspond with the default settings (ideally be the same).
- Example: days, weeks, months etc; carriers, users etc.
- Filters.
- Set of possible rules to select data slice by some value.
- Default set of filters.
- Specific filters for KPI family or one KPI.
- Chart types.
- Example: line, bar, pie. Note: for Group By = Carriers makes no sense to use linear chart.
- XLS output fields.
- Subset of values from KPI base object to output in spreadsheet (define default columns), their order of sequence, mapping and formatting.
- Example: days, weeks, months etc; carriers, users etc.
- Default settings.
- Time Frame. Range of dates per which is calculated KPI value for Level 1. Also it used for visualization of KPI at first time opening of Level 2.
- Group By. It defines method the grouping of subset of values of selected KPI per Time Frame on Chart (Level 2).
- NOTE: Defaults should contain only appropriate values for certain KPI.
- STEP 3. Developer implements solution that suggested the BA with using prepared key information.
[edit] PANEL
Client visibility rule
Client Visibility Rules
Client Visibility Rules affect displaying of DR results in Client Application.
[edit] CHART
- To display value in different type of chart such as line, bar, pie, column, XY scatter, area chart.
- To display value of many KPIs on one chart to show the comparison for analysis (All value points in one graph)
- To use mouse over value on the chart
[edit] BR1.2 [Performance]
- Speed
- To display chart (from KPI value link, filter changing, etc)
- To display value on the chart
- To Download to excel for any report value
- IE. Problem: Performance for displaying yearly data value
[edit] BR1.3 [Scalability]
[edit] BR2 [Cost-based KPIs]
To be able to measure:
- Universal list of KPIs for all modes:
- This list displays when mode of transportation = ALL
- Cost Per KG
- Cost per KG = (Sell Rate/Gross KG)
- Cost Per Pound
- Cost per LB = (Sell Rate/Gross Lb)
- Cost Per P.O.
- Cost per P.O = (Sell Rate/???)
- Cost per SKU item (Item code)
- Cost per SKU item = (Sell Rate/???)
- Cost per Qty
- Cost per quantity = (Sell Rate/Quantity)
- Cost per Pallet
- Cost per pallet = (Sell Rate/Pallets)
- Cost per Package on Pallets/Loose Packages
- Cost per Package on Pallets/Loose Packages = (Sell Rate/Packages)
- Packages = Packages on pallets + Loose packages
- Cost per Package on Pallets/Loose Packages = (Sell Rate/Packages)
- Cost per piece price
- Cost per piece price = (Sell Rate/???)
- List per specific MODE:
- This list displays additional to the universal list if mode specific is selected
- Air
- Cost per Chargeable weight = (Sell Rate/Chargeable Weight)
- Ocean FCL
- Cost per container = (Cost per KG * Gross KG per container)
- Cost per KG = (Sell rate/total Gross KG)
- Cost per container = (Cost per KG * Gross KG per container)
- Ocean FCL
- Ocean LCL
- Cost per CBM = (Sell Rate/CBM)
- Ocean LCL
- Ocean Vendor Console
- Cost per container = (Cost per KG * Gross KG per container)
- Cost per KG = (Sell rate/total Gross KG)
- Cost per container = (Cost per KG * Gross KG per container)
- Ocean Vendor Console
- Truck
- Truck-Dom
- Logic: TMS
- Cost per Lb = (Sell Rate/Gross Lb)
- Consider cost to shipment level to find value within a load
- Cost per load = (Sell Rate/#shipment within the load)
- Cost per Lb = (Sell Rate/Gross Lb)
- Logic: Non-TMS
- Cost per Lb = (Sell Rate/Gross Lb)
- Consider cost to shipment level to find value within a group if there is any
- Cost per Lb = (Sell Rate/Gross Lb)
- Logic: TMS
- Truck-Dom
- Truck
- Exception: Special case for E0. Client Company that is using TMS such as Truck Domestic - EA DOM PORTAL
- Calculate per shipment within the load
- Calculate value into shipment level
- Case of Group shipment - This should be calculated value into shipment level within the group
- Case of Load shipment - This should be calculated value into shipment level within the load
- Exception: Special case for E0. Client Company that is using TMS such as Truck Domestic - EA DOM PORTAL
[edit] Logic
- Cost Per Pound
- value from XML DocLoadPlan (TMS), Total Cost and Total Weight parameters what to be used for calculation of Cost per Pound
[edit] BR3 [Date-based KPIs]
Measuring KPI date based pairing from date below:
- Shipment Created on Date
- Shipment Approved on Date
- Shipment Mode assigned on Date
- Shipment Picked up on Date
- Shipment Departure on Date
- Shipment Arrival on Date
- Shipment Custom Clearance on Date
- Shipment Delivery on Date
- Shipment On time performance
- Universal list of date based KPIs for all modes
[edit] Define KPI
Core of date based KPI is number of days from the shipment X date to the shipment Y date
- It is a number of days from the two dates:
- 1) Created To Approved on Date = Approved on Date - Created on Date
- Number of days since the date of creation the shipment until the date of its approved
- 2) Created To Mode Assigned on Date = Mode Assigned on Date - Created on Date
- Number of days since the date of creation the shipment until the date of its mode Assigned
- 3) Created To Picked up on Date = Picked up on Date - Created on Date
- Number of days since the date of creation the shipment until the date of its picked up
- 4) Created To Departure on Date = Departure on Date - Created on Date
- Number of days since the date of creation the shipment until the date of its departure
- 5) Created To Arrival on Date = Arrival on Date - Created on Date
- Number of days since the date of creation the shipment until the date of its arrival
- 6) Created To Custom Clearance on Date = Custom Clearance on Date - Created on Date
- Number of days since the date of creation the shipment until the date of its custom clearance
- 7) Created To Delivery on Date = Deliver on Date - Created on Date
- Number of days since the date of creation the shipment until the date of its delivery
- 8) Approved To Mode Assigned on Date = Mode Asssigned on Date - Approved on Date
- Number of days since the date of approved the shipment until the date of its mode Assigned
- 9) Approved To Picked up on Date = Picked up on Date - Approved on Date
- Number of days since the date of approved the shipment until the date of its picked up
- 10) Approved To Departure on Date = Departure on date - Approved on Date
- Number of days since the date of approved the shipment until the date of its departure
- 11) Approved To Arrival on Date = Arrival on Date - Approved on Date
- Number of days since the date of approved the shipment until the date of its arrival
- 12) Approved To Custom Clearance on Date = Custom Clearance on Date - Approved on Date
- Number of days since the date of approved the shipment until the date of its custom clearance
- 13) Approved To Delivery on Date = Delivery on Date - Approved on Date
- Number of days since the date of approved the shipment until the date of its delivery
- 14) Mode Assigned To Picked up on Date = Picked up on Date - Mode Assigned on Date
- Number of days since the date of mode assigned the shipment until the date of its picked up
- 15) Mode Assigned To Departure on Date = Departure on Date - Mode Assigned on Date
- Number of days since the date of mode assigned the shipment until the date of its departure
- 16) Mode Assigned To Arrival on Date = Arrival on Date - Mode Assigned on Date
- Number of days since the date of mode assigned the shipment until the date of its arrival
- 17) Mode Assigned To Custom Clearance on Date = Custom Clearance on Date - Mode Assigned on Date
- Number of days since the date of mode assigned the shipment until the date of its custom clearance
- 18) Mode Assigned To Delivery on Date = Delivery on Date - Mode Assigned on Date
- Number of days since the date of mode assigned the shipment until the date of its delivery
- 19) Picked up To Departure on Date = Departure on Date - Picked up on Date
- Number of days since the date of picked up the shipment until the date of its departure
- 20) Picked up To Arrival on Date = Arrival on Date - Picked up on Date
- Number of days since the date of picked up the shipment until the date of its arrival
- 21) Picked up To Custom Clearance on Date = Custom Clearance on Date - Picked up on Date
- Number of days since the date of picked up the shipment until the date of its Custom Clearance
- 22) Picked up To Delivery on Date = Deliver on Date - Picked up on Date
- Number of days since the date of picked up the shipment until the date of its delivery
- 23) Departure To Arrival on Date = Arrival on Date - Departure on Date
- Number of days since the date of departure the shipment until the date of its arrival
- 24) Departure To Custom Clearance on Date = Custom Clearance on Date - Departure on Date
- Number of days since the date of departure the shipment until the date of its Custom Clearance
- 25) Departure To Delivery on Date = Delivery on Date - Departure on Date
- Number of days since the date of departure the shipment until the date of its delivery
- 26) Arrival To Custom Clearance on Date = Custom Clearance on Date - Arrival on Date
- Number of days since the date of arrival the shipment until the date of its Custom Clearance
- 27) Arrival To Delivery on Date = Deliver on Date - Arrival on Date
- Number of days since the date of arrival the shipment until the date of its delivery
- 29) Custom Clearance To Delivery on Date = Delivery on Date - Custom Clearance on Date
- Number of days since the date of custom clearance the shipment until the date of its delivery
- 30) On Time Performance
- 1) Created To Approved on Date = Approved on Date - Created on Date
[edit] Define key parameters
- KPI entity is a shipment.
- KPI function is difference in days between date of arrival of shipment and date of its creating in CT2.
- KPI measure unit is a day.
- Key Date rule. Key events based on following dates:
- Shipment Created on Date
- Mapping: #CT_bo#Created_On_Date
- Shipment Approved on Date
- Mapping: #CT_bo#Approved_On for Truck-Dom that use ASN portal or #CT_bo#Authorized_On for other MOT include Truck-Dom that is not used ASN portal: depends upon Mode of transportation
- Shipment Mode assigned on Date
- Mapping: #Mode assigned_On THIS FIELD IS NOT EXIST>>>need to be added
- Value: This will be the same date as the Approved on date or Authorized on date depends upon mode of transportation selected
- Shipment Picked up on Date
- Mapping: #CT_bo#Actual_Pick_Up_Date
- Shipment Departure on Date
- Mapping Air: #CT_bo#Airport_Of_Departure_Actual_Date
- Mapping FCL:
- Mapping LCL:
- Mapping Client Console:
- Mapping Truck-Dom
- Mapping Truck-Ocean
- Mapping Truck-Air
- Shipment Arrival on Date
- Mapping:
- Shipment Custom Clearance on Date
- Mapping: #CT_bo#Customs_Status_Date
- Shipment Delivery on Date
- Mapping: #CT_bo#Actual_Delivery_Date
- Shipment Created on Date
- For example: Created To Delivered KPI
- Rule: Report should handle CTs with Delivery Date within Time Frame (see below) and calculate KPI function for them.
- Group By methods
- Standard methods: all Time (days, weeks, months, quarters, years); carriers, consignees, shippers.
- Specific methods: planners.
- Filters
- Standard filters: PO contains, SKU contains, Approved Date, Pick Up Date, Routed Date, Delivery Date, Carrier.
- Specific filters: Planner.
- Chart types
- linear chart for every time grouping.
- bar chart for grouping by carriers, planners etc.
- Output fields
- CT#.
- Load #.
- Created to Delivered (KPI column calculated as by formula Actual Delivery Date - Created On Date).
- Created On Date.
- Actual Delivery Date.
- Shipper.
- Consignee.
- Carrier.
- Pick Up Location.
- Delivery Location.
- Planner.
NOTE: need to define and add to list other KPI's which can be overlapped with current (depends from key entity).
- Default settings (in My Profile section).
- Time Frame: to be able select one from previous day/week/month/quarter/year.
- Group By: to be able select one from list included standard and specific "Group By" methods.
[edit] Implementation parts
- Use Client Visibility Rules when showing KPI info for external user(s)
- ........................Internal user(s)
- Settings
- Default: Values of KPI parameters should be set up in My Profile section
- Date KPI panel setting should be added
- Need ability to set up default values for parameters:
- "Time Frame"
- "Group By"
- Level 1
- Initial KPI displaying.
- A table with 4 columns:
- Name of KPI
- Time Frame range
- KPI value (+ KPI measure, maybe in round brackets)
- Change (KPI changes from past Time Frame)
- Headers: Name, Time Frame, KPI, Change
- Created to Delivered KPI on Level 1 (as well as Change) is average value for all shipments delivered per selected Time Frame:
- 1) calculate difference Delivered-Created for every shipment
- 2) get all days as amount of calculated differences
- 3) divide obtained sum by number of handled shipments
- A table with 4 columns:
- Initial KPI displaying.
- Level 2
- Chart displaying
- First time opened chart should be look in correspondence with default settings:
- Group By and Time Period sections should be set in values specified in My Profile
- Chart type should be suitable for Group by value
- Filter Panel should be minimized and all filters are empty
- except Delivery Date filter displayed start ("from") and end ("to") dates of Time Frame range
- Selecting of new "Group By" or "Time Period" values refreshes the chart without additional confirm
- Changes on Filters Panel will update the chart after pressing of "Generate Result"
- Delivery Date filter after manual update should used instead "Time Period" for chart displaying
- First time opened chart should be look in correspondence with default settings:
- Chart displaying
- Level 3
- preadsheet displaying
- 1) Click on "Download to Excel" button and get file
- OR
- 2) Activate by clicking on or chart (when it is bar type), define output fields, click on the button
- preadsheet displaying
[edit] Logic
[edit] BR4 [Total (Counters)]
- To be able to measure:
- Shipment Count (CT records)
- Total KG shipped
- Total Loads (loads = TMS Dom only)
- Total Masters (all NON-TMS modes)
- Total Cartons
- Tital Pallets
- Container Count
- Total CBM (maybe)
[edit] BR5 [Lane Optimization / Aggregation]
The basic premise of transportation is that the more you ship the smaller your unit cost (if you buy 2 pens from Amazon.com the cost of shipping will usually be the same for 2 pens as it is for 1 pen, thus by shipping 2 pens together your cost per pen decreased by 50%).
If we would want to add another layer of complexity we would start “modeling” the “current data” to show something like this:
You ship 10 shipments per month from company A to company B with 1000 kg each at the moment. Your average cost per xx (item, kg etc) is $ 5.-
IF you started shipping 2 shipments per month from Company A to Company B with 5000 kg each, your average cost per xx (item, kg etc) would be $ 2.50**
To get to the **$2.50 number some slightly more complicated referencing/estimating system would have to be implemented, one that would measure different quantity ranges (1, 100, 500, 1000, 2000, 3000, 5000, 10000 KG – for example) and measure the proportional reduction in unit cost (cost per KG for example) for each weight break, then apply this proportional reduction to the “model based” quantity per shipment.
1) How many shipments for every "shipper/consignee" pairing per week, per month, etc
2) How much quantity, weight in KG/LB, pallets, CBM, etc per shipment
- To be able to measure:
- Pallets per/ KG per/CBM per/Cartons Per
- Per shipment
- Per week
- Per month
- Per container
- Pallets per/ KG per/CBM per/Cartons Per
[edit] Functional/Non-Functional Requirements
<Identify all functional and non-functional requirements. Maintain standard headings. If a specific requirement is not required, note as Not Applicable. Each functional requirement must trace back to a specific business requirement.>
[edit] CyberTrax2 Internal Application
<Identify all functional requirements for CT2 Internal Application>
[edit] User Interface Requirements
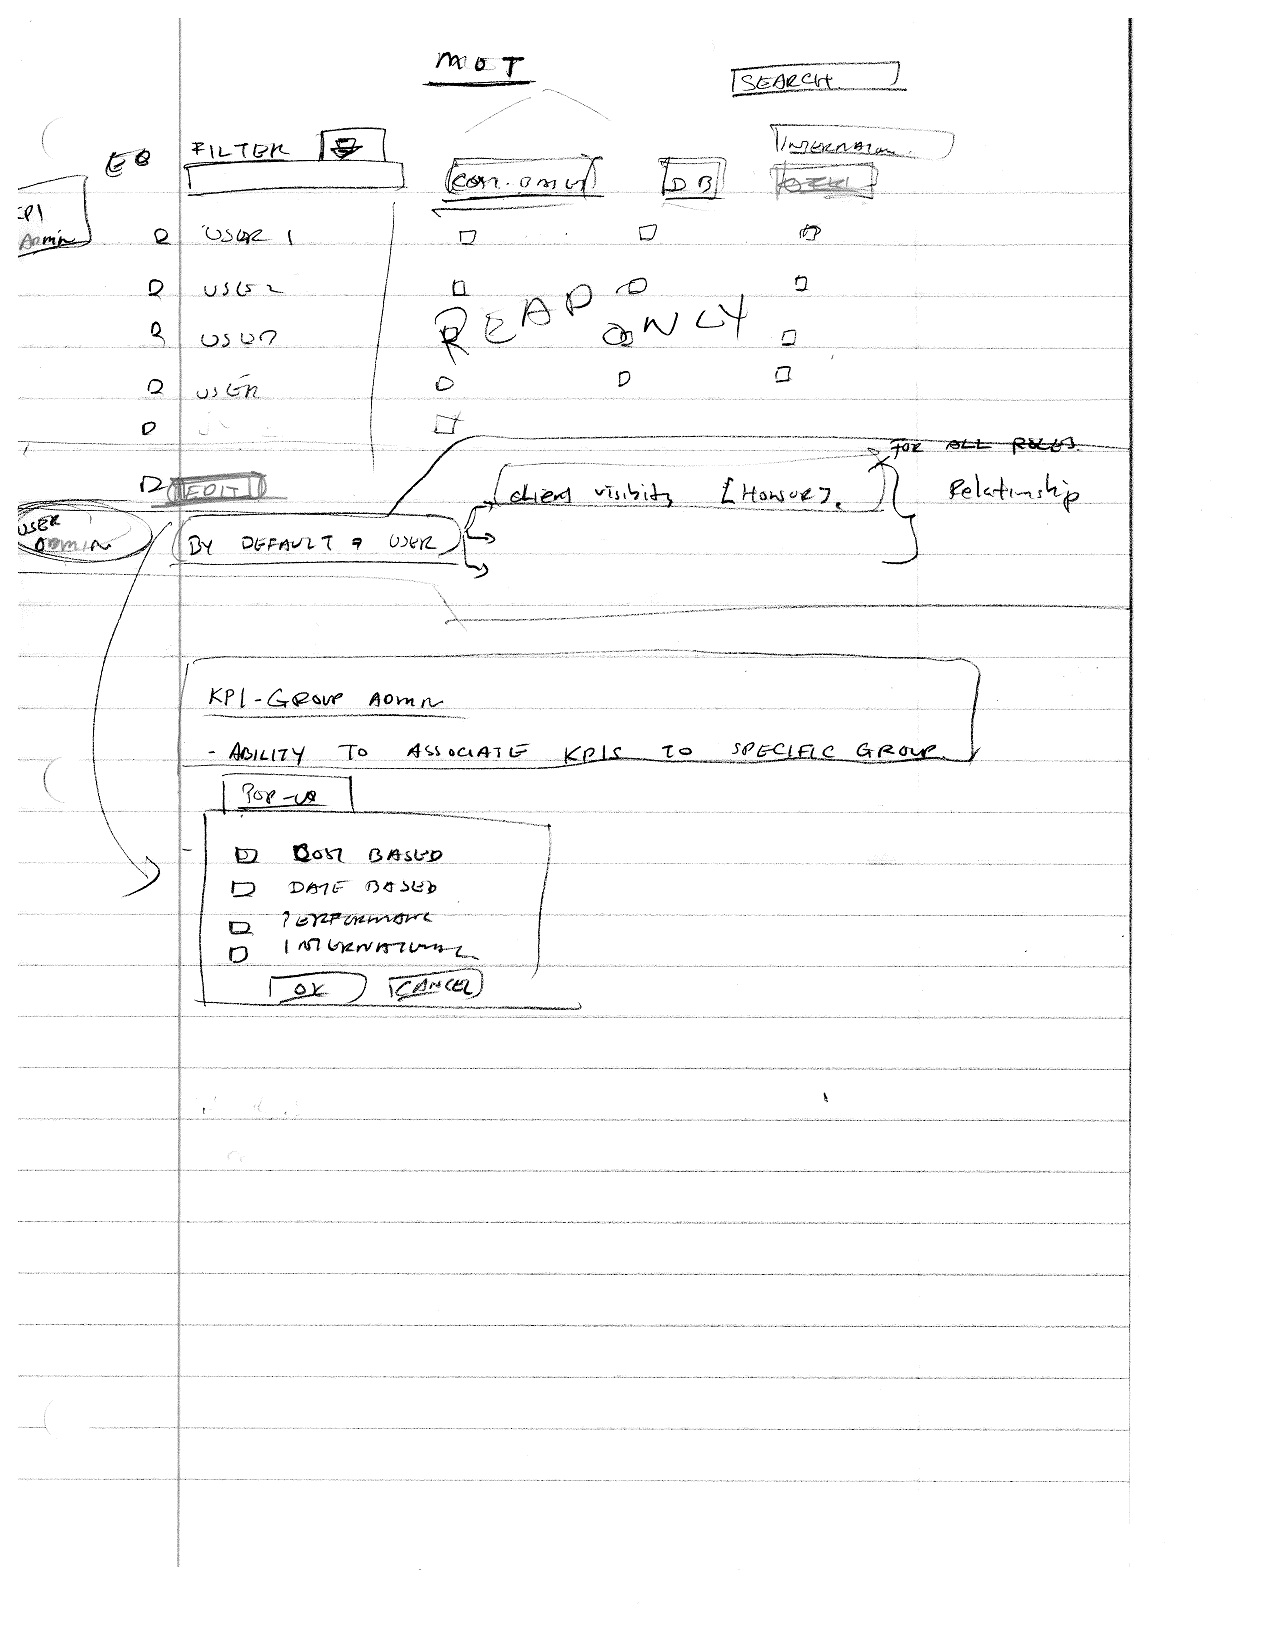
- Refer to #ADMIN
- Also refer to below wireframe:
- External KPIs should be granted based on subscription structure. This should be managed at the admin level.
- Example: Elizabeth Arden signed up for 60-day subscription to KPIs. At the end of the 60-day subscription, all EA users would be de-entitled to KPIs.
- Email notification to users for subscription expiration date. Date calendar for subscription should be managed on Admin level for each client company
- External KPIs should be granted based on subscription structure. This should be managed at the admin level.
- KPI Admin should be it's own menu item. All KPI user/client administration functions should be located within this menu item.
[edit] Reporting Requirements
- No Reporting Requirements for Internal Application
[edit] User Access / Security Requirements
- Refer to #ADMIN
- KPIs will be entitled to each specific user (will need multi-edit functionality) via Admin level.
- Regarding Multi-Edit Functionality - if there are any conflicts, then display a "grey" checkbox for the feature in question.
[edit] Logging Requirements
- Actions on System level and Admin level should be recorded in System Log.
[edit] Group / Master Requirements
- Costs will be distributed to each shipment level based on Mode Of Transportation. Each mode will have a different distribution rule.
- Costs for TMS clients will be calculated at load level.
- All currency conversion rules will need to be applied at the shipment level and then aggregated.
[edit] Filtering Requirements
- Will need filtering capabilities [E0] in User Level Admin
- KPIs will also have unique filtering capabilities (refer to SOWs)
[edit] Archiving Requirements
- All shipments (including Archived shipments) will need to be considered while calculating KPIs.
[edit] CyberTrax2 Client Application
<Identify all functional requirements for CT2 Client Application>
[edit] User Interface Requirements
- KPI Dashboard
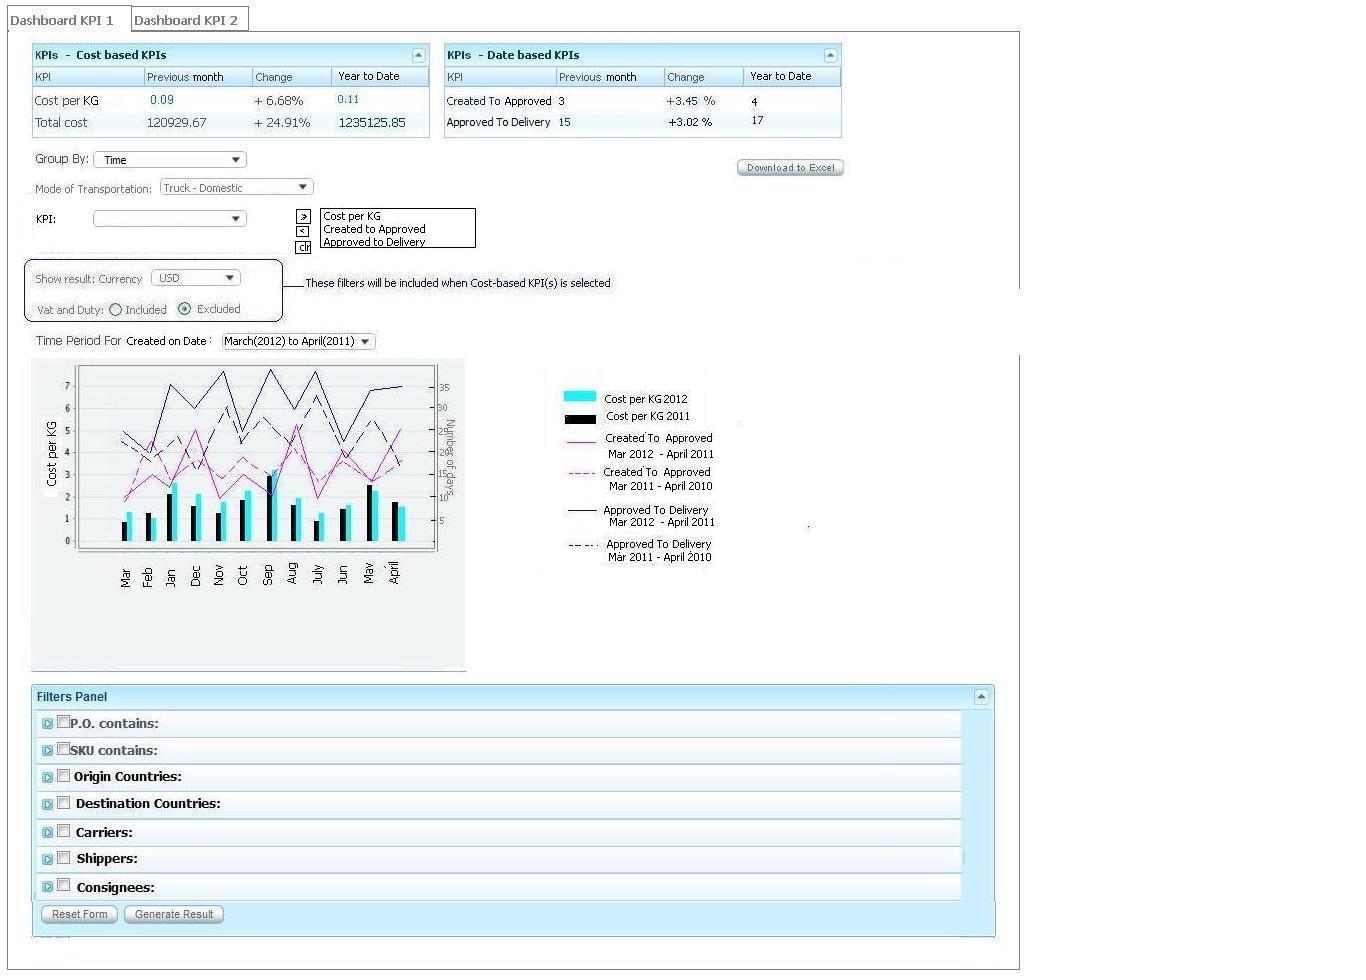
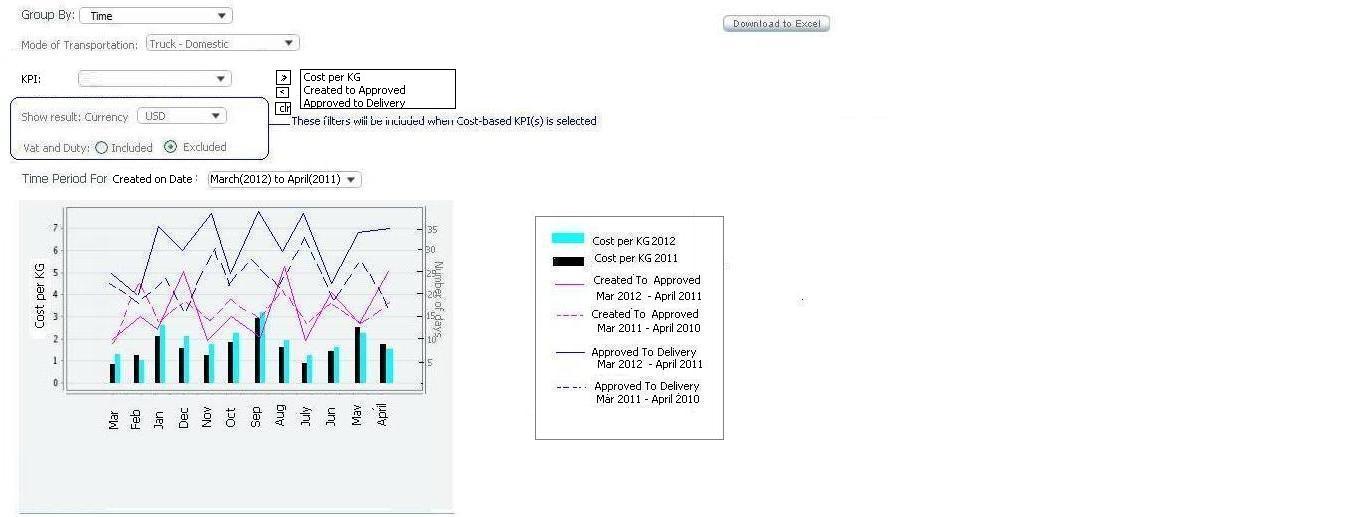
[edit] EXAMPLE DASHBOARD 1
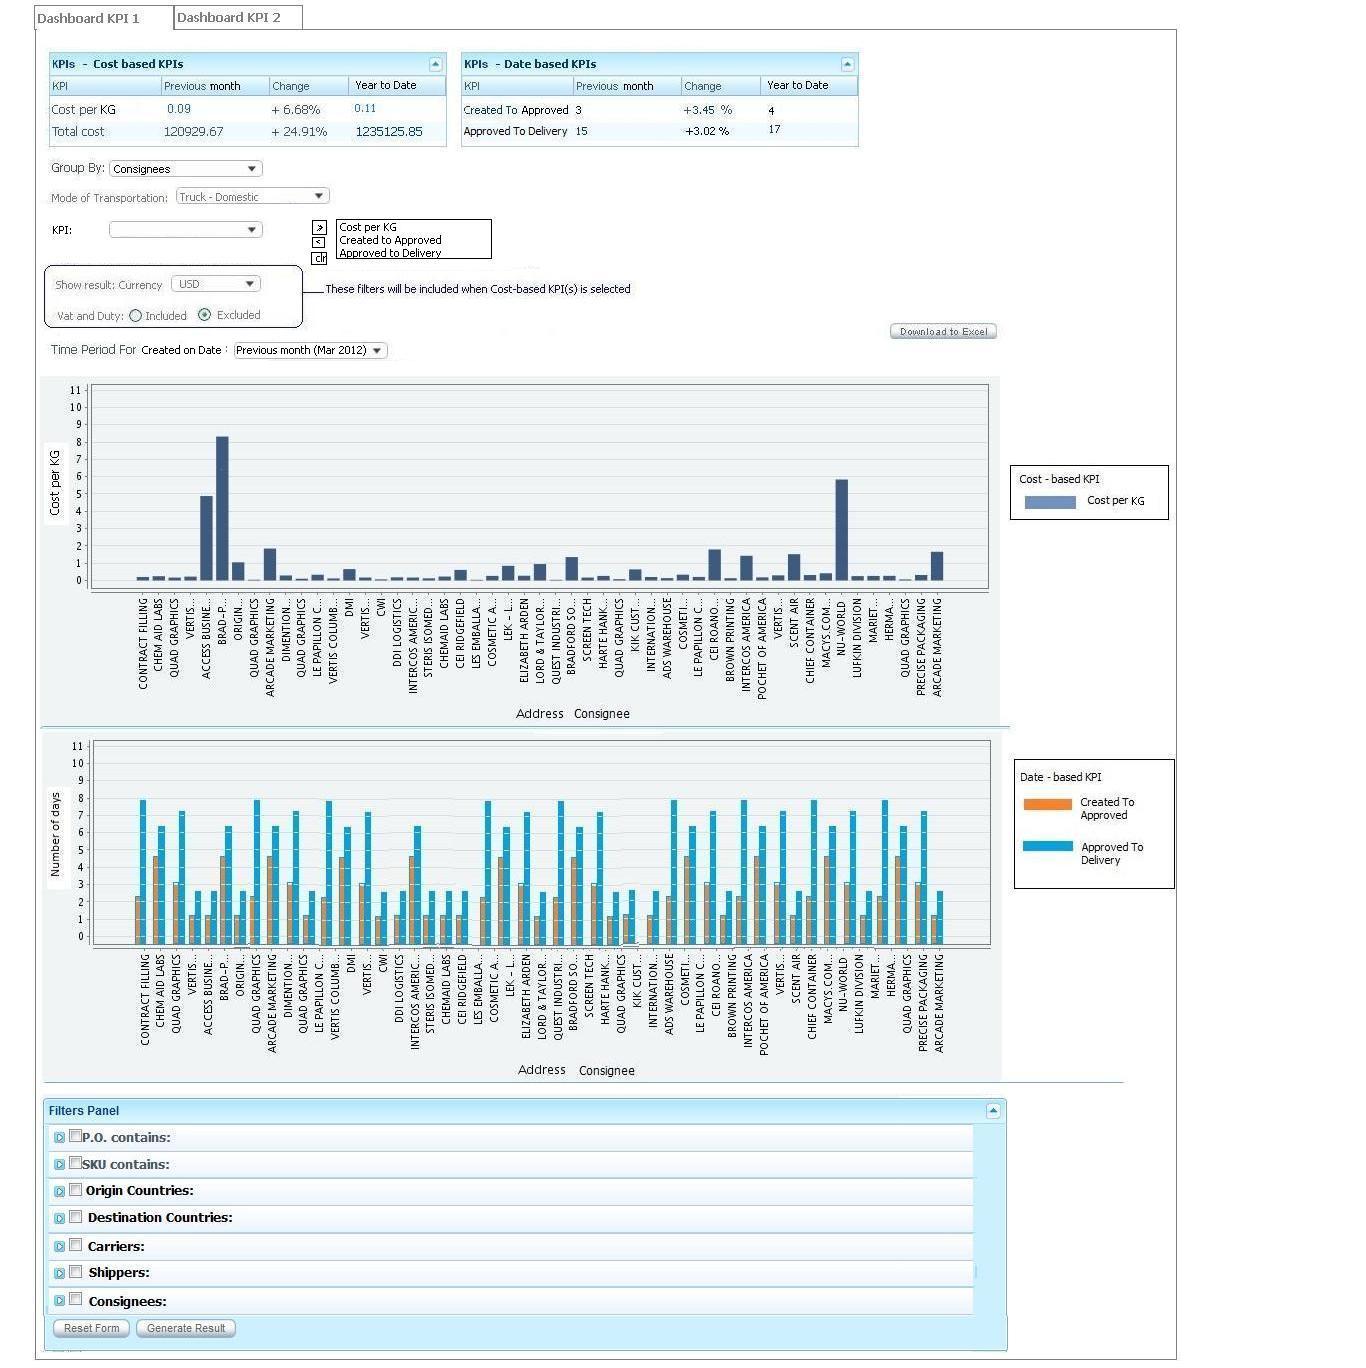
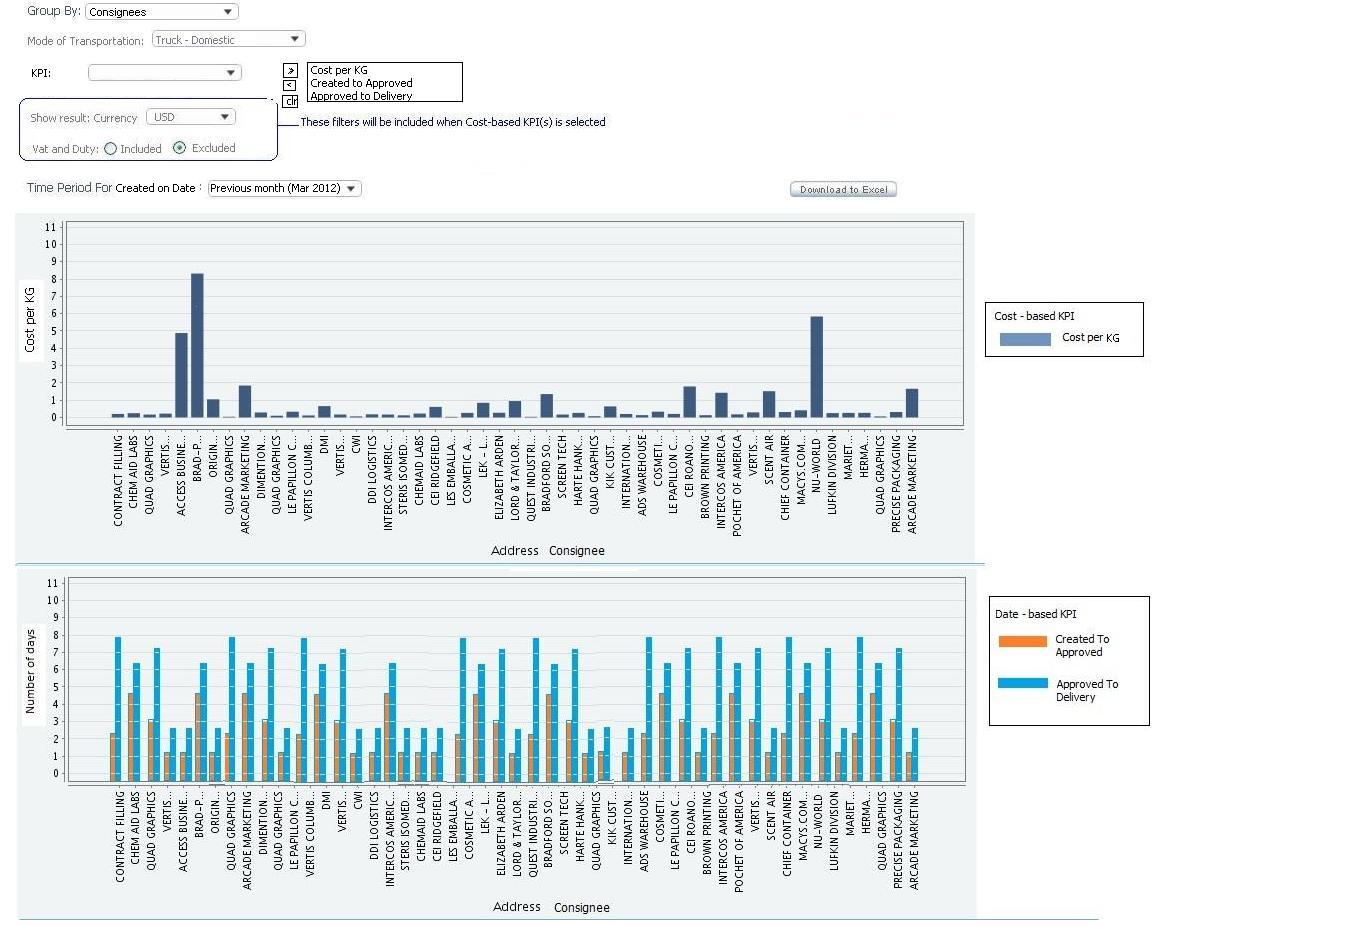
[edit] EXAMPLE DASHBOARD 2
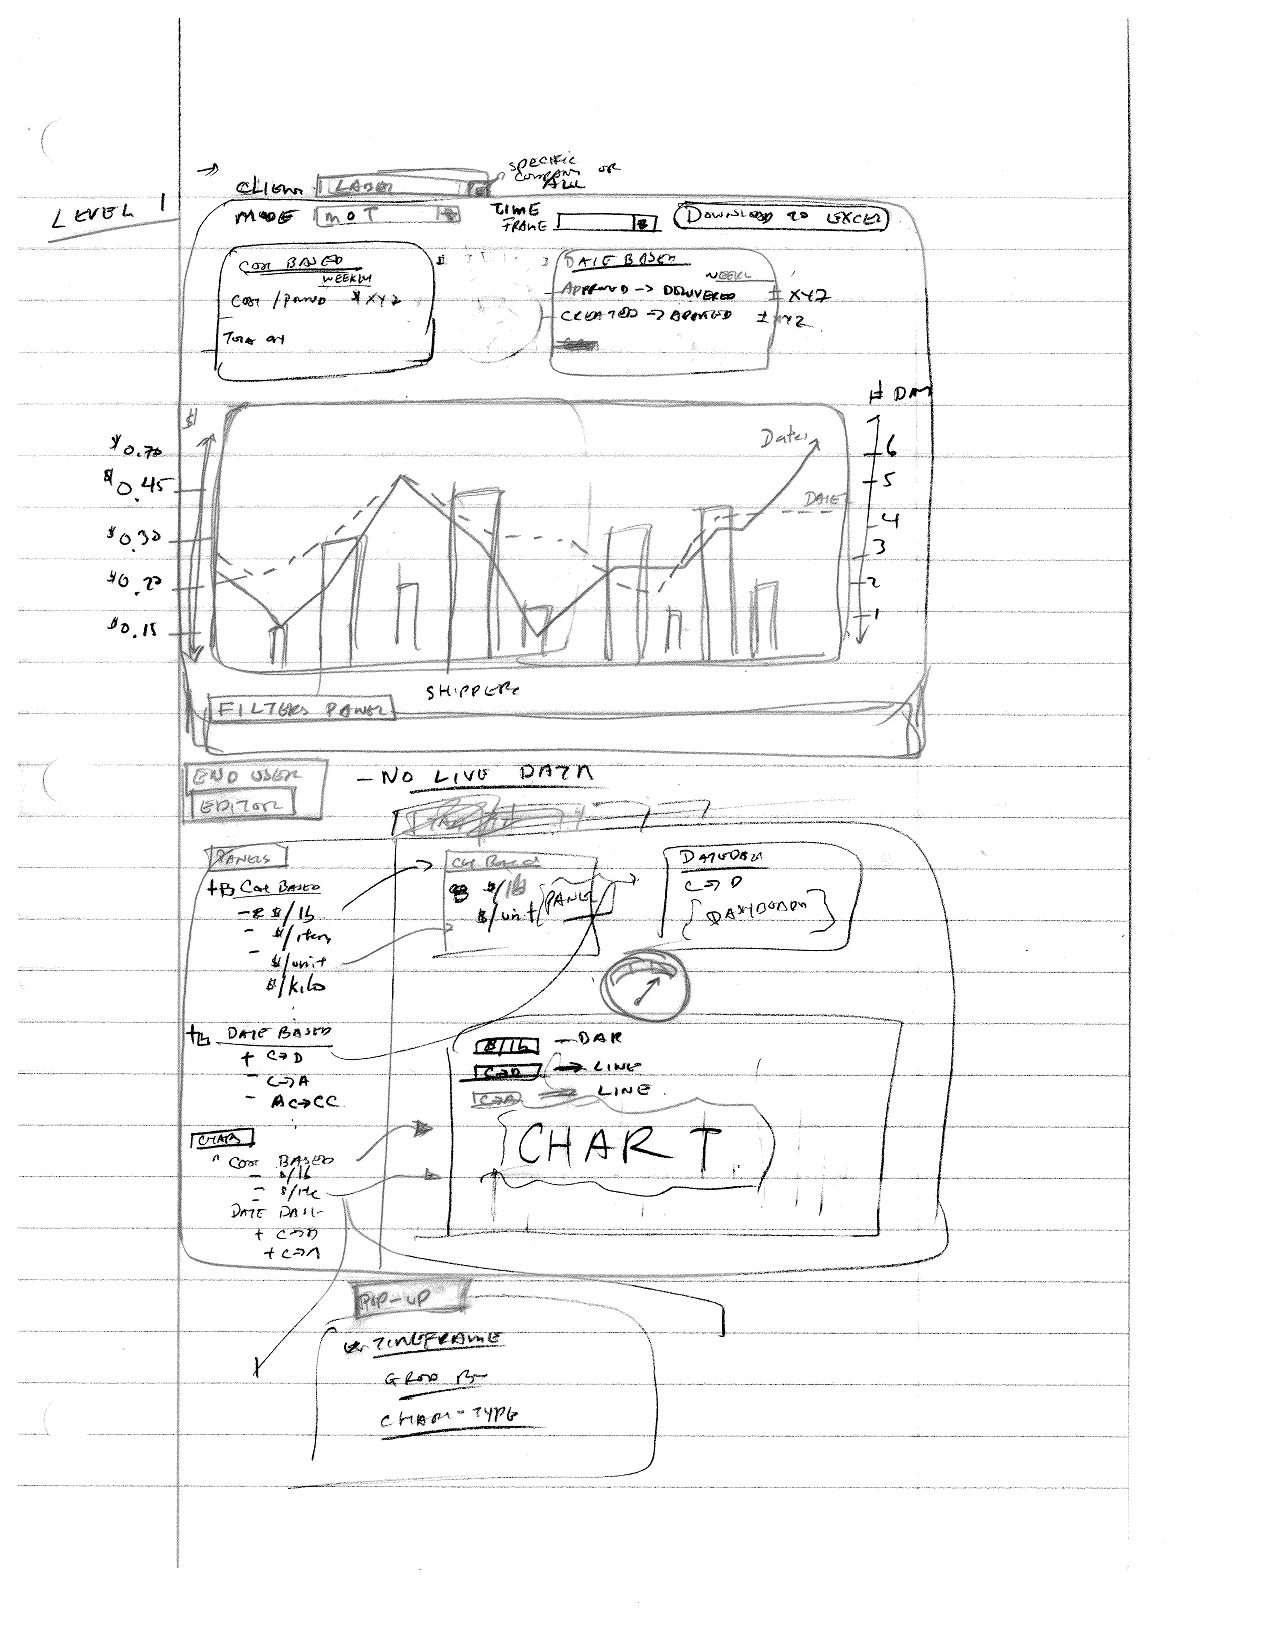
- KPI Editor
[edit] Reporting Requirements
- Download to Excel is required
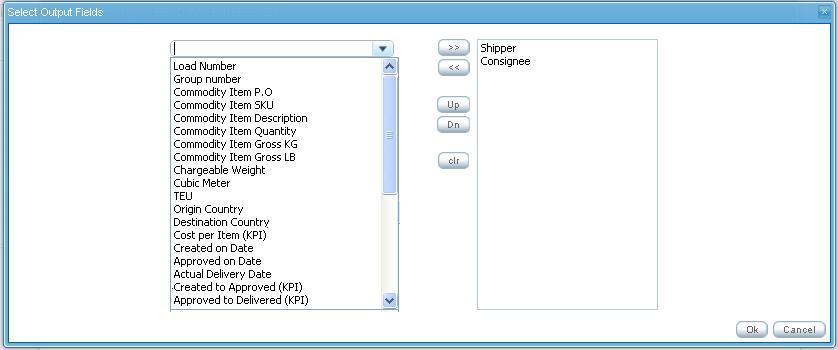
- Should allow users to select which fields (multi select capabilities) to include in the Excel report.
[edit] User Access / Security Requirements
- System Admin should be implemented. See #System_Level
- Accessibility to KPI data must honor client visibility rules.
- KPI accessibility based on paid-subscription structure.
- User Level Admin - grey out KPIs that a user does not have access to
- KPI Dashboard - if subscription ends, or if a KPI is de-entitled for a user, then any saved dashboard panels/charts for that KPI should read "Please subscribe to <xyz> KPI"
[edit] Logging Requirements
- No Logging Requirements
[edit] Group / Master Requirements
- Costs will be distributed to each shipment level based on Mode Of Transportation. Each mode will have a different distribution rule.
- Costs for TMS clients will be calculated at load level.
- All currency conversion rules will need to be applied at the shipment level and then aggregated.
[edit] Filtering Requirements
- Must allow for multiple filtering options at both chart & panel level.
- Filter costs for full costs and VAT/Duty-free costs
[edit] Archiving Requirements
- No Archiving Requirements in Client Application
[edit] Persistence
System must remember last state (location, state [open/closed], settings) of Dashboard for individual user to reproduce it at the next login.
[edit] Non-Functional Requirements
<Identify all non-functional requirements for both CT2 Client Application and CT2 Internal Application>
[edit] Performance Requirements
- Assume 30 simultaneous users
- Speed for loading chart
- Maximum response time: 3-seconds
- Speed for loading overlapping multiple KPIs
- Maximum response time: 3-seconds
- Speed for download to excel
- Maximum response time: 3-seconds
[edit] Capacity Requirements
- Currently, there are no additional capacity requirements to support KPIs
[edit] Support / Maintenance Requirements
[edit] User Guides
- Marc will create video user guides for Internal users. We may contract external vendor to create video user guides for external clients.
[edit] Training
- No special training requirements. Video user guides should be sufficient.
[edit] Log(s) Accessibility
- No special logs for KPIs. Admin changes will be recorded in Systems Log which support team currently has access to.
[edit] Testing Requirements
- Marc will lead the UAT.
- Should prepare test cases with prepared data and expected values prior to actual delivery.
- Once system is delivered, then compare system generated values to expected values.
- Utilize Download To Excel to cross-verify system calculations
- All data validations (ie.. all shipments have origin/destination countries, all shipments have required dates, all countries are mapped to a region, etc..) will need to be in place and verified prior to testing & delivery.
[edit] Security Requirements
- No special security requirements for KPI
[edit] Technical Design & Solution
[edit] Mock ups
<Include mock-ups of UI changes, report changes, etc..>
[edit] Adding dashboard tab
[edit] Naming and editing tab's name
[edit] Removing tab
[edit] Technology Stack & Architecture
<Include changes to existing Technology Stack & Architecture - new libraries, updated library versions, new software/hardware, new interfaces, etc..>
[edit] Technical Diagrams
(Flow Chart, Sequence, UML, Systems Architecture, Technical Architecture, Data Architecture, etc..)
<Include architecture diagrams and flow charts>
[edit] Web / Application (New/Modified classes, methods, etc..)
<List new or modified classes and methods>
[edit] Database (DDL changes - new/modified tables, indexes, stored procedures, etc..)
<Summarize database changes>
[edit] Configuration (Config File changes)
<Summarize config changes>
[edit] Logging (Log File changes)
<Summarize Log File changes and locations>
[edit] External Interfaces (EDI Message(s), external vendors)
<Identify any new external interfaces. Include sample request and reply along with field definitions. Include Source/Target server(s)/webservice(s) and functional accounts. If this is a modification of an existing EDI message, include samples of current message(s) and new message(s)>
[edit] SOW 1
[edit] Info
- mantis parent: 0003545: [DR/KPI DR KPI Framework Phase I (SOW 1) ..... <parent mantis for this phase>]
- mantis category: DR/KPI:ph1
[edit] Business Requirements
- Optimize KPIs performance
- Deliver first KPI panels, overlap multiple KPIs chart, interaction result based on filter(s), and download to excel ability
- For overlap multiple KPIs in one chart if it is possible then implement it. If not, we can show KPIs result in separated charts to show side by side in order to help user for analysis.
- Build KPI Dashboard first phase to be considered to future phases for flexibility
- Using tool from vendor evaluation to produce KPI results: Jreport, LogiXML, or Prognos.
- Decision will be made for which vendor we will select upon feedback from everyone in the team. Jreport is number one at this point in term of pricing. So please evaluate this asap.
- Data set (fields) is provided for generating KPIs
- Please see spreadsheet for all the fields that will be needed to generate KPIs results at 0003545
- List of KPIs for phase I
- Cost Based KPI
- Cost per KG
- Date Based KPI
- Created to Approved
- Approved to Delivery
- Cost Based KPI
- Using tool from vendor evaluation to produce KPI results: Jreport, LogiXML, or Prognos.
- Apply client visibility rules
[edit] Overlapping KPIs
- Optimize performance of KPIs
- Dashboard display
- KPIs will be created/displayed on Dashboard Tab layer
- Start with one dashboard tab only
- See example dashboard 1 and 2 for group by TIME based and NON-Time based at #User_Interface_Requirements_2
- Any/all KPI dashboards should be able to be filtered based on "Created On Date" after May 1, 2010
- KPIs will be created/displayed on Dashboard Tab layer
- DR KPI Level 1
- Panels, Charts, and Filters display on the same level on the dashboard
- Panel columns consist of:
- Heading of the top of panel contains category KPI report name such as Cost Based KPI, Date Based KPI
- KPI consists of a list of Name of object KPI report sush as Cost per item, Cost per pound under Cost based KPI panel, Created to Approved, Approved to Delivery under Date based KPI panel
- Time frame for ATD is the name of selected time frame for ATD displays in column heading (dynamic per specified time frame selected) such as previous week, previous month, previous quarter, previous year and display value.
- Value: average value for specific time frame
- Changes percentage value contains percentage change of value per specified time frame compared to the same previous period
- Label: Change
- Formula: ((data)/(previous data) - 1) * 100%
- data: data from time period defined in profile
- previous data: data from previous same period (default is defined in user profile)
- Year to Date value contains average year to date value from year to date (previous week)
- Label: Year to Date
- Calculated value for specified time frame
- User can select time frame from provided list of values
- Panel row consists of:
- Object report name , value 1, value 2, value 3 per row
- Total (x) is sum of Total cost Only (This is for cost based only)
- This shows total X per selected time frame and percentage change of total X compared to the same previous period
- Value: sum of all cost for specific time frame
- Change formula: ((sum of values from period time frame)/(sum of values from previous period time frame) - 1) * 100%
- See mock up below:
- Panel columns consist of:
- Panels, Charts, and Filters display on the same level on the dashboard
NOTE: Each panel can consist of many KPIs. It is upon KPI(s) that users wish to see from their own visibility info.
- Chart display allows overlap multiple KPIs charts into one chart display for data comparison with different criteria
- If Time based group by is selected, then displays overlap multiple KPIs in a chart
- If Non-time based group by is selected, then displays separated charts of each class of KPIs and allows overlapping multiple KPIs inside of the KPI class/catagory in a chart
- Axis Y of chart (vertical) is always the KPI value based such as Cost per pound, Cost per Item, etc
- This could be dual Axis chart
- Axis X of chart (horizontal) can reflect time frame for ATD for group by data
- Define Scale Axis
- Label for parameter from filters selected
- Define type of chart: Bar, Line, Scatter plot, etc
- Phase I: As we do not give the flexibility for what type of charts to user, default for type of charts should be set such as Cost per Item will use Bar chart as default setting. Created to Approved and Approved to Delivery could be bar chart next to each other as default for the group by of Non-time based. If it is time based group by, it could be "line chart".
- Download to Excel button
- Displays output list select option
- Chart display allows overlap multiple KPIs charts into one chart display for data comparison with different criteria
TIME BASED Group By
This is just a concept for overlap multiple KPIs in one chart with different KPI classes if it is possible to implement by using Jreport, LogiXML, ...etc. If it is not possible, show result separated charts side by side for what make sense such as one chart for cost based and the other for date based.
NON-TIME BASED Group By
- Filters consists of two sections:
- Top section: select parameters to display value
- Group by:
- Carriers - if this is selected, shows result for previous average time frame
- Shippers - if this is selected, shows result for previous average time frame
- Consignees - if this is selected, shows result for previous average time frame
- Geography - if this is selected, shows result for pairing of from to regions for previous average time frame such as North America to Asia, Western Europe to Asia, ...etc
- Time - if time is selected, time frame for ATD criteria below will be applied
- Mode of Transportation: Single select
- All - Default
- Air
- Ocean FCL
- Ocean LCL
- Ocean Client Console
- Truck Ocean
- Truck Air
- Truck Domestic
- KPI: Single select or multiple select
- If possible for overlap multiple KPIs in one chart, then allows multiple selects KPIs
- If not possible for overlap multiple KPIs in one chart, but possible to set this filter and apply for separated charts then allow multiple selects KPIs
- If filter is set per chart, then each KPI has its own filter with single select KPI
- Phase I: List of universal KPI cost based:
- Cost per KG
- Phase I: List of universal KPI date based:
- Created to Approved
- Approved to Delivery
- Show Result:
- Currency // this is currency for cost based only (show when cost based KPI is selected) - this should be able to set from Editor as well(TBD)
- Time Frame for ATD:
- Weekly // if non-time filter selected, shows point of average data for previous week. If time filter is selected, shows point of value for weekly result for 12 weeks previously
- Data point of value starts every Monday (if current week is Week 15, then shows: Week 3, Week 4 Week 5, Week 6, Week 7, Week 8, Week 9, Week 10, Week 11, Week 12, Week 13, Week 14)
- Monthly // if non-time filter selected, shows point of average data for previous month. If time filter is selected, shows point of value for monthly result for 12 months far back for current year and previous year comparison
- Blue line - if this month is April, shows Mar 2012, Feb 2012, Jan 2012, Dec 2011, Nov 2011, Oct 2011, Sep 2011, Aug 2011, July 2011, Jun 2011, May 2011, April 2011
- Red line - if this month is April, shows Mar 2011, Feb 2011, Jan 2011, Dec 2010, Nov 2010, Oct 2010, Sep 2010, Aug 2010, July 2010, Jun 2010, May 2010, April 2010
- Quarterly // if non-time filter selected, shows point of average data for previous quarter. If time filter is selected, shows point of value for quarterly result for 8 quarters data points
- Data point of value starts from the previous quarter, if today is in April month of 2012, show 1st QT 2012, 4th QT 2011, 3rd QT 2011, 2nd QT 2011, 1st QT 2011, 4th QT 2010, 3rd QR 2010, 2nd QT 2010
- Yearly // if non-time filter selected, shows point of average data for previous year. If time filter is selected, shows point of value for yearly average result back to the first year that have the records for comparison.
- Data point of value starts from the previous year to years previously such as year 2012, 2011, 2010, 2009 etc.
- Weekly // if non-time filter selected, shows point of average data for previous week. If time filter is selected, shows point of value for weekly result for 12 weeks previously
- Group by:
- Bottom section: filters to narrow result
- PO
- Item Code
- Origin Countries
- Destination Countries
- Carriers
- Shippers
- Consignees
- Top section: select parameters to display value
- Filters consists of two sections:
- DR KPI Level 2
- Download to Excel (Common option for all KPIs)
- Output fields: Define Field Mappings (CT to XLS)
- E0. Client Company
- Master number
- Group number
- CT# (This should be always on the XLS report)
- Load Number (EA-Truck Dom/ TMS tag)
- Group Number
- Shipper Name
- Shipper City
- Shipper State
- Shipper Country
- Shipper Region
- Consignee Name
- Consignee City
- Consignee State
- Consignee Country
- Consignee Region
- Carrier Name
- Mode of Transportation
- Commodity Item P.O
- Commodity Item SKU
- Commodity Item Description
- Commodity Item Quantity
- Commodity Gross KG (Truck)
- Commodity Gross LB (Truck-Domestic)
- Total Pkg on Pallet
- Total Loose package
- Chargeable Weight (Air)
- Cubic Meters (LCL)
- Container # (FCL and Vendor Console)
- Container size/type (FCL and Vendor Console)
- TEU (FCL)
- Total "E0 Sales" in USD
- Bill to party
- Total VAT
- Total Duty
- Total charges excluding VAT/DUTY
- Cost per Item (KPI)
- Created on Date
- Approved on Date
- Actual Delivery Date
- Created To Approved (KPI)
- Approved To Delivery (KPI)
- NOTE 1: Once list of object reports of KPIs is added, this should be added into output list as well.
- NOTE 2: For the field(s) that is not applicable to the record, show n/a result on the spreadsheet if user selects to see this output
- Output fields: Define Field Mappings (CT to XLS)
- Download to Excel (Common option for all KPIs)
- Validation
- Limitation for number of KPIs per chart
[edit] Cost Based KPI
Mantis: 0003565: [DR/KPI Cost Based KPI: Cost per KG]
- Consider Cost for close shipment ONLY, apply the same logic as GM split
- Take the re-open and close shipment into the consideration as well to re-calculate
- TblGeneric Shipment: A lastCloseDate, OCStatus
- Admin to manage E0. client company and E0. client company group with bill to party (ies): Consider Cost for Sale invoices that are linked to Bill to Party(ies) with E0. Client Company or/and E0. Client Company Group as this is associated to only what cost to pay for the specific client
- This table is needed to be created on Admin for admin to set up the link to Bill to party(ies) with E0.
- Example:
CT/Group
Sale invoices:
Invoice 1 Bill to ABC amount $20
Invoice 2 Bill to ABC amount $20
Invoice 3 Bill to XYZ amount $50
Invoice 4 Bill to XYZ amount $10
Sample 1:
E0. Client company links to bill to party ABC
Take invoice 1 and 2 for the cost consideration
Sample 2:
E0. Client company links to bill to party ABC and XYZ
Take invoice 1, 2, 3, and 4 for the cost consideration
- Currency: Apply new currency rule from GM Split for conversion. Default: USD
- IF Actual Arrival Date is EMPTY, THEN uses currency from Created On Date
- IF Actual Arrival Date is SET, THEN uses currency from Actual Arrival Date
- Group shipment --> Consider currency from date logic above to the lowest number of CT in the group
- Include/Exclude VAT and Duty report ability. There are basically 3 separate components to take into consideration
- Import VAT/TAX charge code (Any charges for which CC:1204 was used)
- VAT on Services Charges: VAT added to invoice based on user selection (per office: for the one that is checked to apply VAT)
- Duty charge code (Any charges for which CC:1201 was used)
- This should be defined on Admin (KPI) for the charge codes for VAT and DUTY
- Label would always show what is included or exclude in a particular KPI report
- Client Visibility: This is a subset of current Client Visibility logic
- Consider E0. Client Company shipment ONLY. Do not include the shipment with E1, E2, E3 visibility to the client
[edit] Cost per KG
Cost Calculation
The total cost is the sum of all sales invoices issued against E0. Client Company or E0. Client company group. CT record or the group shipment
Example:

Case 1
CT 123456 has three sales invoices issued against it.
Invoice 1 in the amount of $5.00
Invoice 2 in the amount of $10.00
Invoice 3 in the amount of $5.00
Total cost for the shipment would be $20.00
Case 2
If CT 123456 is a part of a master 123, Master 123 has CT 123456 and CT 123789 and both CTs have three same sales invoices issued against it.
This sum should be of sales invoices billed to a pre-determined bill to party linked to the client company that is viewing the KPI for External users
Take this total cost and divide it by the desired KG to determine the cost per KG.
- In case of group shipments, we need to make sure the KG is the total sum of all of the CT's in the group
Example:
This shipment is 10 KG
Invoice 1 Bill to: ABC amount $25.00
Invoice 2 Bill to: ABC amount $15.00
Invoice 3 Bill to: XYC amount $5.00
Invoice 4 Bill to: XYZ amount $50.00
When XYZ looks at the KPI for this shipment, average cost per KG: $5.5
(Sum of the invoices billed to XYZ for this shipment = $55.00 and this shipment weights 10 KG): 55/10 = $5.5 per KG
Universal Logic for cost per KG for all modes(AIR, FCL, Client Console, LCL, Truck-Dom, Truck-Air, Truck-Ocean):
- Cost per KG = (Sell Rate/Gross KG)
- Exception Truck-Dom
- Logic:
- TMS:
- Cost per KG = (Sell Rate/Gross KG of record(s))
- Consider cost to shipment level to find value within a load to line item (commodity) level
- Non-TMS:
- Consider cost to shipment level to find value within a group to line item (commodity) level
- TMS:
- Logic:
- Exception Truck-Dom
[edit] Date Based KPI
Mantis: 3564 - Created to Approved AND Approved to Delivery
[edit] Validation
Approval on Date or Authorization on Date: MUST NOT be empty
- IF Mode of transportation is assigned AND Authorized on Date is EMPTY THEN system automatically updates Authorization on Date to Today date.
[edit] Created to Approved
- Number of days since the date of creation the shipment until the date of its approved
- Logic per shipment: Created To Approved = Approved on Date - Created on Date
- Logic KPI for Average number of created to approved = ((Sum of Created to Approved number of days)/(number of shipments))
- For the specific shipments that have created on date AFTER authorization date. Logic will show a negative value for the pairing of created on date to approved on date. Please see solution logic below:
- IF (Created on date > Authorization on Date), THEN shows result for KPI report as 0 ZERO value to avoid negative value.
- For the specific shipments that have authorization on date EMPTY, take the value of created on date value
Mode of Transportation
- AIR Mapping:
- Created on Date: #CT_bo#Created_On_Date
- Approved on Date: CT_bo#Authorized_On
- Ocean FCL Mapping:
- Created on Date: #CT_bo#Created_On_Date
- Approved on Date: CT_bo#Authorized_On
- Ocean LCL Mapping:
- Created on Date: #CT_bo#Created_On_Date
- Approved on Date: CT_bo#Authorized_On
- Truck
- Truck-Dom TMS Mapping:
- Created on Date: #CT_bo#Created_On_Date
- Approved on Date: #CT_bo#Approved_On
- Truck-Dom TMS Mapping:
- Truck-Dom NON-TMS Mapping:
- Created on Date: #CT_bo#Created_On_Date
- Approved on Date: CT_bo#Authorized_On
- Truck-Dom NON-TMS Mapping:
- Truck-Ocean Mapping:
- Created on Date: #CT_bo#Created_On_Date
- Approved on Date: CT_bo#Authorized_On
- Truck-Ocean Mapping:
- Truck-Air Mapping:
- Created on Date: #CT_bo#Created_On_Date
- Approved on Date: CT_bo#Authorized_On
- Truck-Air Mapping:
[edit] Approved to Delivery
- Number of days since the date of approved the shipment until the date of its delivery
- Logic per shipment: Approved To Delivery on Date = Delivery on Date - Approved on Date
- Logic KPI for Average number of approved to delivery = ((Sum of Approved to Delivery number of days) / (number of shipments))
- For the specific shipments that have created on date AFTER authorization date. Logic will show a negative value for the pairing of created on date to approved on date. Please see solution logic below:
- IF (Created on date > Authorization on Date), THEN shows result for KPI report as 0 ZERO value to avoid negative value.
- For the specific shipments that have authorization on date EMPTY, take the value of created on date value
Mode of Transportation
- AIR Mapping:
- Approved on Date: CT_bo#Authorized_On
- Delivery on Date: CT_bo#Actual_Delivery_Date
- Ocean FCL Mapping:
- Approved on Date: CT_bo#Authorized_On
- Delivery on Date: Container#Actual_Delivery_Date
- Ocean LCL Mapping:
- Approved on Date: CT_bo#Authorized_On
- Delivery on Date: CT_bo#Actual_Delivery_Date
- Truck
- Truck-Dom TMS Mapping:
- Approved on Date: #CT_bo#Approved_On
- Delivery on Date: CT_bo#Actual_Delivery_Date
- Truck-Dom TMS Mapping:
- Truck-Dom NON-TMS Mapping:
- Approved on Date: CT_bo#Authorized_On
- Delivery on Date: CT_bo#Actual_Delivery_Date
- Truck-Dom NON-TMS Mapping:
- Truck-Ocean Mapping:
- Approved on Date: CT_bo#Authorized_On
- Delivery on Date: Container#Actual_Delivery_Date
- Truck-Ocean Mapping:
- Truck-Air Mapping:
- Approved on Date: CT_bo#Authorized_On
- Delivery on Date: CT_bo#Actual_Delivery_Date
- Truck-Air Mapping:
[edit] Comments from Alex to SOW 1 section
Tira, please fix the following ASAP:
- Business Requirements still contains questions// completed
- Gauges should be removed// completed (Jreport, LogiXML will provide user flexibility to select what type of chart they would like to see...so I take this part out completely
- KPI: Single select section contains reference to other units - I thought we agreed to limit phase 1 to kg // Completed. I moved all the list of KPIs Universal and unit measurement for mode specific to the top section. It is not under SOW 1 anymore.
[edit] Some Clarifications from Alex
[edit] Key Time Intervals
Two Key CT intervals (in days) are between the following 3 dates:
- date when shipment was created
- date when shipment was approved for pick up
- date when shipment was delivered
See mappings and more info here: #Created to Approved, #Approved to Delivery
[edit] Descartes TMS based Data vs CT2 based
For some E0 that are using Descartes TMS some data is stored in a different way. For example cost of CT.
Also for TMS there is a concept of load that is not available for Truck mode for E0 that do not use TMS.
[edit] Simple Shipment count DR
- this DR should appear within panel on KPI Dashboard ("KPI" link form CT2 Client Header)
- requirements:
- DR panel has two filters: (Client E0) - single select; Created on date (from date to date).
- Below is radio ("Shippers"-default vs "Consignees" )
- Below is radio (bar chart-default vs pie)
- Below is graphics
- axis X: 6 bars for top 5 (as far as number of CTs) Shippers (or Consignees) with labels and 6th represents all remaining Shippers/Consignees
- axis Y: Number of CTs (for selected E0, for specific Shipper/Consignee)
- User can change filters/controls and system will re-draw plot on the fly
- must be integrated seamlessly from:
- look and feel experience (should blend in CT2 Client front end)
- security (display only dashboard allowed for particular user)
- QA test: assign one KPI to one user, one to another and verify what they see
- parameter for report should be controlled through user profile and DR panel
- number 5 should be a default parameter in user profile
- also user should be able to change it on the screen and system would re-draw
[edit] Work breakdown structure
[edit] 3567 Rapidly Create #Simple Shipment count DR using just ZK libs and java libs
- Mantis: http://ct.jaguarfreight.com/mantis/view.php?id=3567
- Dev: Sasha
Prove that it is possible to Rapidly Create #Simple Shipment count DR using just ZK libs / java libs.
[edit] 3575 Rapidly Create #Simple Shipment count DR using LogiXML
- Mantis: http://ct.jaguarfreight.com/mantis/view.php?id=3575
- Dev: Kostya
Prove that it is possible to Rapidly Create #Simple Shipment count DR using LogiXML.
[edit] 0003564: [DR/KPI] Date Based KPI: Created to Approved AND Approved to Delivery
[edit] 0003565: [DR/KPI] Cost Based KPI: Cost per KG
[edit] 0003568 [DR/KPI] Integrate Cost based and Time based KPIs into one DR panel that will appear on CT2 Client dashboard
[edit] Dependencies
All tasks except 3568 can be started right away. Once they all complete 3568 can be started.
