Carrier Statistic Report
From UG
(Difference between revisions)
(→User Defined Conditions) |
(→Figure 1. Mode FCL) |
||
| Line 94: | Line 94: | ||
==== Figure 1. Mode FCL ==== | ==== Figure 1. Mode FCL ==== | ||
| - | [[ | + | [[FCL]] |
==== Figure 2. Mode LCL ==== | ==== Figure 2. Mode LCL ==== | ||
Revision as of 17:41, 5 February 2010
Contents |
Parent Mantis
Mantis
Name
Carrier statistics
Business Needs and Requirements
This report is a statistic report that user can generate in order to view statistic numbers of:
- FCL: How many containers with different types and sizes with T.E.U. per month from each origin terminal to each destination terminal?
- LCL: How many CT shipments and how much total of gross weight and total in cbm per month for each LCL shipment from each origin terminal to each destination terminal each month?
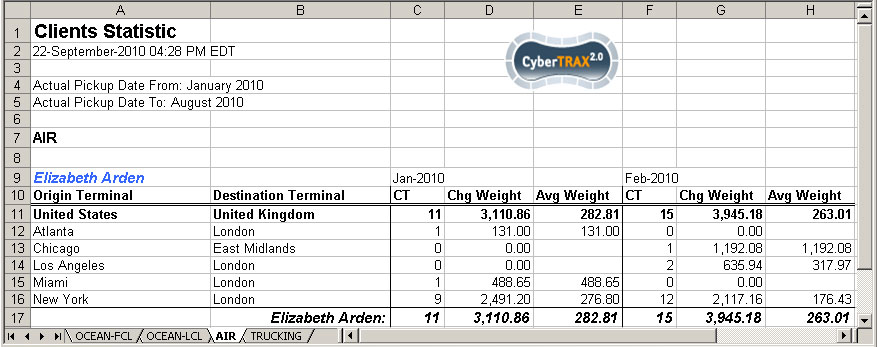
- Air: How many CT shipments and how much chargeable weight and average weight per month for each airline from origin terminal to destination terminal?
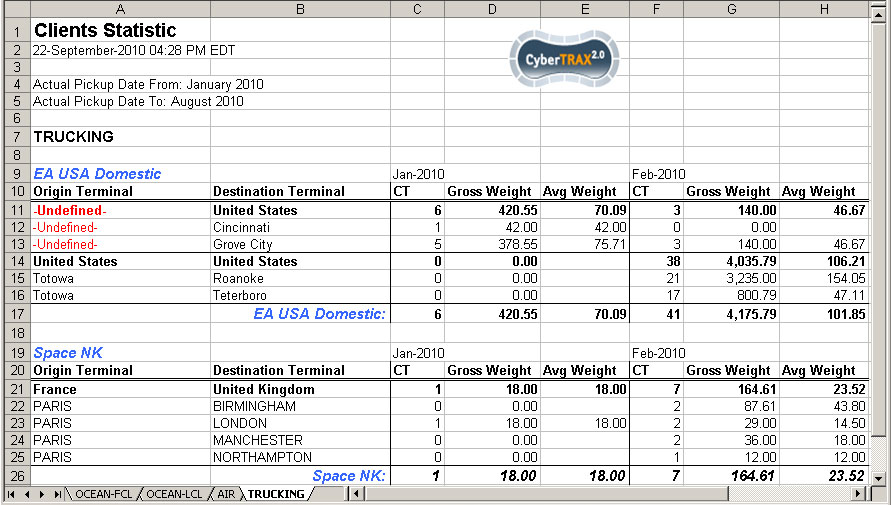
- Truck: How many CT shipments and how much total Gross weight per month for each trucking company from origin terminal to destination terminal?
Technical Specification
Summary
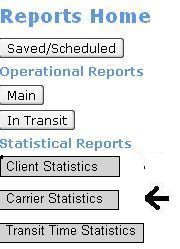
This report allows users to create carrier statistics reports. It can be created from Report Home under Statistical Reports OR from Save/Scheduled Reports under Report Class drop-down menu.
User Interface
- Statistical Reports Menu
Carrier Statistic Report
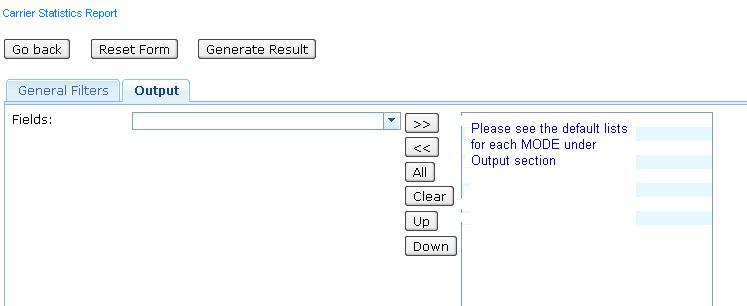
1. Tabs
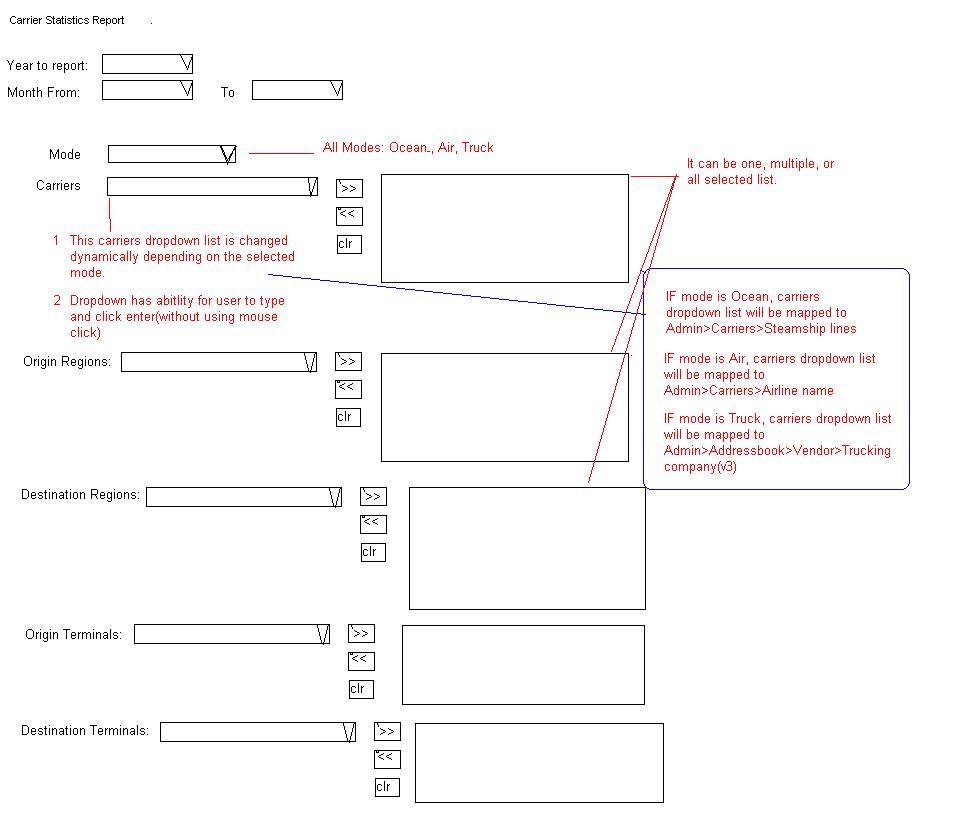
- General Filters Tab -> see figure under User Defined Conditions
- Output Tab -> dynamically list of headings depend on MODE. See figure below and detail under Output
Hard Coded Conditions
- Total per month consider Actual Collection Date
- Per carrier company
- Per Mode in case of many modes selected (when Mode filter is blank; consider all modes)
MOT = FCL
- Total containers with each combination between types and sizes listed below
- 20 ft (include all types)
- 40 ft (include all types except HQ)
- 40 hq (40 hq only)
- 45 ft (include all types)
- T.E.U (Twenty Equivalent Unit: 20 ft = 1 Equivalent)
- NOTE: 1 40 ft/hq or 45 ft = 2 T.E.U
- Total of each column
- Mapped to ContTab.size and ContTab.Type (15 cases to fit in 4 categories)
MOT = LCL
- Total CT shipments
- Total Gross weight
- Total in cbm
- Average weight
- Total of weight/number of CT shipments
- Total of each column
- Mapped to ContTab.Table A. GrandTotal.Ttl G kg (2 decimal places)
- Mapped to ContTab.Table B. Total (in cbm)
MOT = AIR
- Total CT shipments
- Total chargeable weight
- Average weight
- Total of weight/number of CT shipments
- Total of each column
- Mapped to ExpTab.17b: Chargeable weight
MOT = Truck
- Total CT shipments
- Total Gross weight
- Average weight
- Total of weight/number of CT shipments
- Total of each column
- Mapped to ContTab.Table A. GrandTotal.Ttl G kg
User Defined Conditions
- See UI for General Filters tab below
- Most filters are "multi select"
- Check box in front of each filter. If filter is set, check box MUST be automatically checked vise versa.
- Filters consists of several groups
- Every filter is connected by AND and sub selections inside each filter combo-box are connected by OR
- For example: (Year to Report = 2009) AND (Mode = Ocean) AND (Carrier = APL OR Carrier = COSCO)
Note:If a filter is not set, that means "all". For ex, if Mode is not selected, that means Mode = all modes
Output
Figure 1. Mode FCL
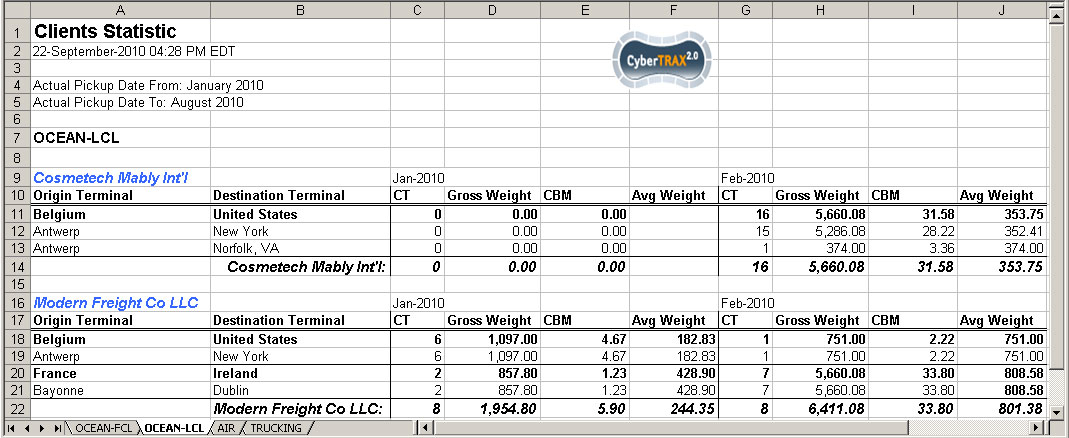
Figure 2. Mode LCL
Figure 3. Mode Air
Figure 4. Mode Truck
Summary
- Output is a spreadsheet
- Spreadsheet tabs: there is one tab per mode
- Spreadsheet consists of Header, Body, and footer
- Header:
- Report name
- Date time stamp
- Criteria(list of filters selected)
- Jaguar Logo
- Body:(general info)
- consists of sections: separately by from country to country
- Each section label from country -> country
- Figure 1: refer an example of one section
- Many sections should be separated by one row
- Table consists of columns. See #Column Definitions below
- Footer:
- There is no footer
Columns Definitions
MOT: FCL
Origin Terminal
- location that shipment is moved from (port)
Destination Terminal
- location that shipment
