KPI
From UG
(→Lane) |
(→new admin options v3) |
||
| Line 2,934: | Line 2,934: | ||
Shipment Count wk 13 2013 CEI.xls | Shipment Count wk 13 2013 CEI.xls | ||
| - | |||
| - | |||
| - | |||
| - | |||
| - | |||
| - | |||
| - | |||
| - | |||
==== fields list v3 ==== | ==== fields list v3 ==== | ||
Revision as of 15:42, 7 May 2013
Info
Mantis
Mantis:
- categories: DR/KPI:ph1, DR/KPI:ph2, DR/KPI:ph3
Environments
- QA/SIT/UAT:
Good account to test with:
- name: KPI_User@com.com
- pwd: Admin1234
SVN
- /branches/DR_KPI
Team
- Sponsor: Simon
- UAT/Product Manager: Marc
- SA: Alex
- PM: Tira
- Dev1: Sasha
- Dev2: Misha
- Dev3: KU
- QA: Roma
- Graphics: Vic
Email groups:
alex@jaguarfreight.com; a.pivniak@elcosol.com; k.ushakov@elcosol.com; v.makhankov@elcosol.com; r.lakhno@elcosol.com; m.tymoshenko@elcosol.com; montira@jaguarfreight.com;
Glossary
- BI - Business Intelligence
Requirements
2012
- This Phase One should include first portion of DRs/KPIs delivered
- Must be production quality
- This phase is for Arden primarily (all MOTs) but also for Sales Dept to show possibilities to prospects and existing Clients
- This project is very important top visibility project
- Also right tool/lib should be evaluated/selected for the future (example: LogiXML vs ZK API/other Java APIs)
2013
Simon asked to release all classes of KPIs by April One.
Simon/Marc identified limited list of "Free Client KPIs", to be released ASAP:
Free KPIs
1. Counters: Shipment Count
2. Counters: Total spend (including or excluding VAT)
3. EU: Average KG per shipment
4. EU: Average pallets or cartons per shipment
5. Dates: On time performance (estimated vs actual date unless an actual “due date” is available (ASN Portal customers)
6. Dates: Average transit times
KPI Classes
KPI classes (groups):
- Cost per unit (CPU)
- Lead Times
- Counters
- Lane Optimization (LO)
- Equipment Utilization (EU)
- Overlap
Individual KPIs
Cost per unit (CPU)
a. Cost per Lb
b. Cost per Kg
c. Cost per Item
d. Cost per Pallet
e. Cost per Carton
f. Cost per chargeable Weight (air)
g. Cost per container (FCL)
h. Cost per CBM (LCL)
Dates (Lead Times)
a. Created to delivered
b. Approved to delivered
c. Created to Approved
d. Approved to pick up
e. Pick up to delivery
f. On Time performance (OTIP)
g. Created to Cargo Due
h. Approved on Date to Cargo Due
i. Basic to Super planner approved
k. Time to update
Counters
a. Shipment Count
b. CTs count
c. Gross KG Shipped
d. Cartons count
e. Pallets count
f. Container count
g. CBMs count
h. Chargeable weight count
i. Total Spend
Lane Optimization (LO)
a. Average shipments per lane (per week, per month)
Equipment Utilization (EU)
a. KGs per shipment
b. LBs per shipment
c. Pallets per shipment
d. CBM per shipment
e. Avg Pallets per container (FCL)
f. CBM per container
Overlap
a. Overlap Equipment Utilization against CPU
b. Overlap Lane Optimization against CPU
DR1 and DR2
! These reports are no longer in use
Moved to DR KPI Phase One DR1 DR2
KPI Framework
Link to KPIs
KPI link will show up for users who have access to at least one KPI. See Figure below.
This link will lead to KPIs multi tab view - see another Figure in the #Standard Layout section below.

Standard Layout
KPIs are to conform to standard layout that is well defined.
KPI link leads to KPI Home page - see Figure below.
Page has multiple tabs - one per class.
On each tab there is a KPI selector that allows user to choose one KPI from the class.
Page contains info for one KPI at each moment in time.
KPI Page consists of the following sections/panels:
Please notre that definitions of above sections differ depending on what type of View is selected. See #Views

KPI class tabs
On the highest level we spread all KPIs across tabs. One KPI class per tab.
Title
This is a title for current page (for selected tab).
Main menu
- Client Company - single select, list restricted by user visibility
- this might soon be removed !!!
- MOT - single select
- View type - controls what is displayed inside panels. Options:
- Main View
- Shippers View
- Consignees View
- Carriers View
- Lanes View
- this might soon be removed !!!
- Ttl Weight/Avg Cost/Count/Avg Weight selector
- This defines axis Y for Top Right Panel
- this might soon be removed !!!
- not used for Main View !
- options:
- Total Weight
- Average Cost
- Shipment Count
- Average Weight
KPI Panel
- individual KPI selector: Ex: cost per kg
- Unit of measurement: Ex: USD
- number: actual value of KPI (if "weekly" is selected then average for last full week, if "monthly" - average for last full month)
- arrow change indicator: comparatively to previous period defined by "timeframe" (up - red, down - green)
- percentage: change in % comparatively to previous period defined by "timeframe"
- timeframe: options: weekly, monthly, quarterly, yearly
- traffic light: Gage, indicates tolerance level, see #Tolerance levels parameters
Tolerance levels parameters
This is aka "Traffic light"
- this is a list of parameters managed by user in user profile
- controls what is considered green vs yellow vs red zone for KPI
Notifications for Traffic light
- When color changes from yellow to red send e-mail with notification to user
- In user profile on Client under specific KPI allow to turn on/off notification. By default it is off
Left panel, Top right panel, Bottom right panel
Content on these panels is controlled by "View Type" selector. See details below.
Views
We defined 5 views: Main, Consignees, Shippers, Carriers, Lanes.
See details below.
Main View
Main View aka MV
MV Left panel
Left column:
- weeks to date sorting from current week to previous weeks (current week, last week, previous week .... )
- arrow indicator - change from previous week
- Mouse over value description
- gage indicator
- Mouse over value description
Right column:
- KPI value
- Mouse over value description
- single click on a table row of the Left Panel functionality:
- Highlight a table row for a particular week/quarter/month to the row that is selected
- A dot on the graph for a particular week/quarter/month on top right panel is highlighted. If there is no data (empty), no highlight is needed.
- Apply a bottom right panel to show a particular week/quarter/month information chart for each tab (Shippers, Consignees, Carriers, and Lanes). Display a frame label to show what data/value based on such as X Week/Y Quarter/Z Quarter or 2012 YTD average
- ie. Cost per LB with weekly KPI, user clicks on 28 week (08-14 Jul 2012) then a dot on the graph for 28 week on the Top right is highlighted. The bottom right panel shows bar or pie segment chart with number for top/bottom display for a particular 28 week information. Display a frame label as 28 week (08-14 July 2012).
MV Left panel drilldown
For Main view
- double clicks on a table row of Left Panel
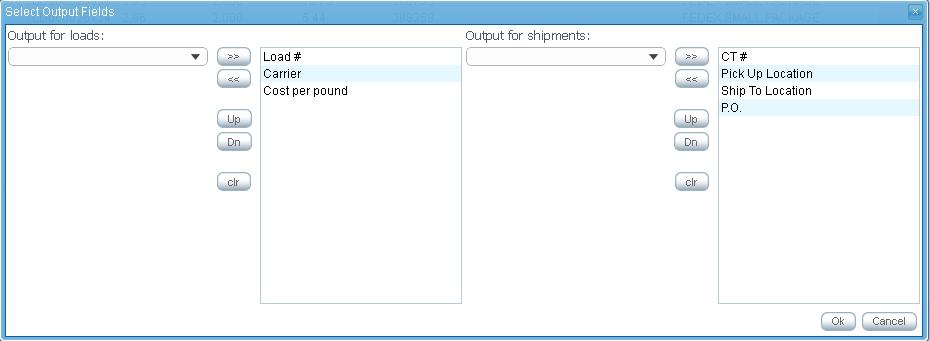
- Show pop-up panel with download to excel button
- Select output fields option window pop-up for user to select output list and click OK
- Download Excel spread sheet
- double clicks on a table row of Left Panel
For Other views Commented out this until we decide to enable other views.
MV Top right panel
Axis X: all weeks to date (w1, w2, .... ) or months to date (Jan, Feb,....Dec)
Axis Y:
- plot A: KPI this year and #YTD average line for this year
- plot B: KPI this year -1 and #YTD average line for this year
- plot C: KPI this year -2 and #YTD average line for this year
- etc... ;what is the oldest data to display is manager through KPI Admin
YTD average line
This is a horizontal line on top right plot indicating "YTD average" for KPI, say cost per kg.
Year Selector Panel
Has been added in SOW 33.
- Compare graph for all years as well as YTD average for all years
- Ability to choose what years graph to show/hide
- Grid table control graph each year
- Each year has different color in order to differentiate years
- Trend shows data point each time frame each year
- YTD Average data show side by side with year trends selected
- Provide/show list of all years for trend and YTD with enable/disable graphs
- Scrolling up/down if there are long list of years
- Sorting years from earliest year to latest year top to bottom
- Currently we will list data from year 2011, so there will be year 2011 and 2012 on the table grid at this time. Future the list will be added under earlier year.
NOTE: See mock up below for concept of the requirements

MV Bottom right panel
This panel has 4 tabs: Shippers, Consignees, Carriers, Lanes.
Each tab has same design.
- Type selector: bar/pie
- Display X selector and Display Top/Bottom selector:
- indicating by how many items to group, for example: "show top 5 Shippers"
- Plot:
- Axis X: top/bottom 25, 20, 15, 10, 5 for Shippers or Consignees or etc
- Axis Y: KPI value
MV Bottom right panel drill down
- If user clicks on a particular bar or pie segment of chart then system should produce pop up with CT/load details for relate data (use same format as was defined by Cost per Pound KPI implemented by AK)
- Bottom right chart. See figure below. This mock up is from Cost per LB with Load#. Other KPI might be slightly different such as for other MOTs that has no Load, do not show load.
- Step 1). User can click on a bar or pie segment of chart.
- Bottom right chart. See figure below. This mock up is from Cost per LB with Load#. Other KPI might be slightly different such as for other MOTs that has no Load, do not show load.
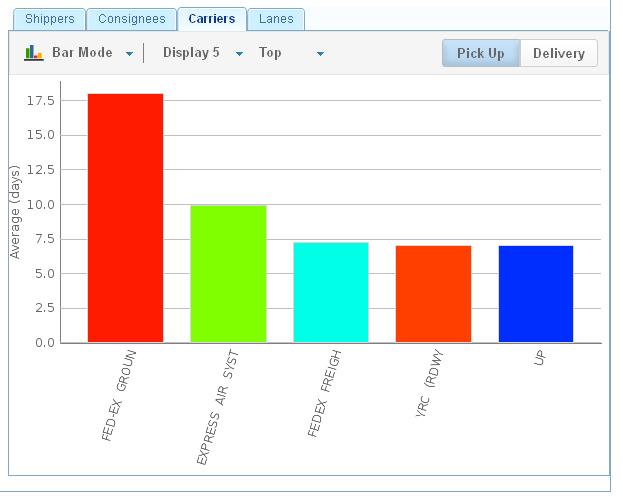

- Step 2). As of this panel shows bar chart per carrier for 2012 YTD average, user clicks on FEDEX FREIGHT bar chart on Carrier tab, then system shows pop up HTML report with ability to download to excel. This HTML report shows information for a specific carrier.
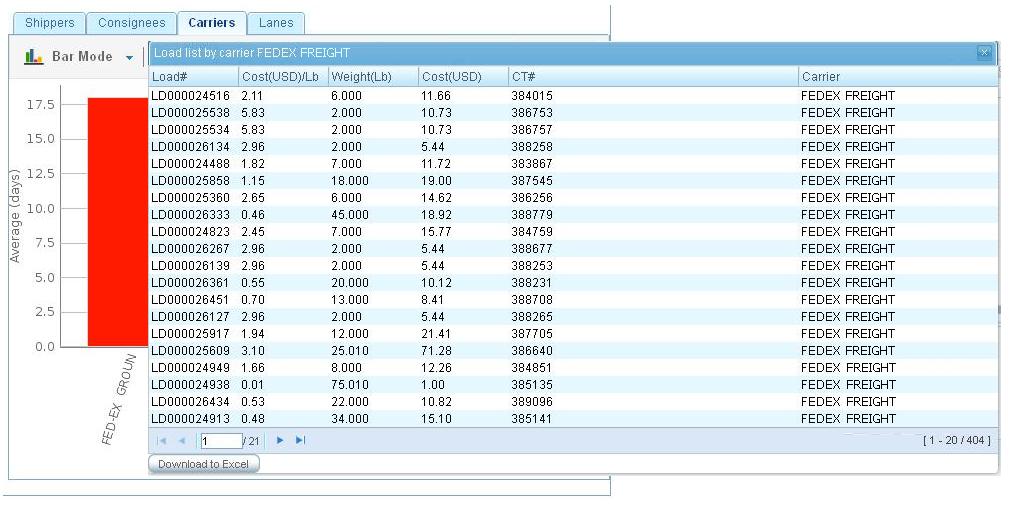

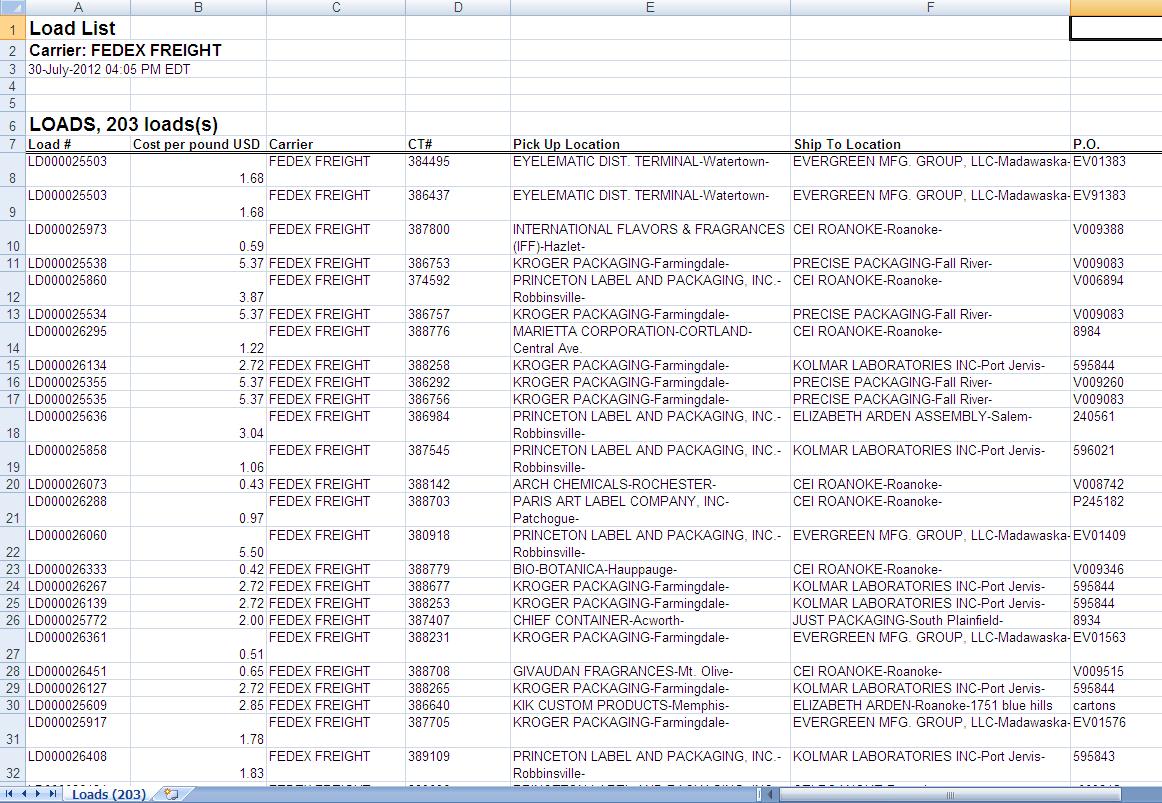
- Step 3). User can download information to excel by clicking Download to Excel button then selecting output fields and clicking OK. Excel report should show as small detail as possible per line for this particular carrier, so user can use the excel spreadsheet to create their own pivot tables, ...for their own analysis. Output list is upon user selecting output fields.
NOTE: Output fields lists should be available for user to select (similar to Main report) as many fields as possible.


Other Views
We decided to implement other views later or possibly have only one (Main) View.
Carriers View
I commented out this section - use wiki Edit to see text.
Consignees View
Same data/layout as in #Carriers View but for Consignees.
Shippers View
Same data/layout as in #Carriers View but for Shippers.
Lanes View
Same data/layout as in #Carriers View but for Lanes.
Visibility
For given KPI that is enabled for given Client user use only CT records that satisfy "default client user visibility" (E0 or E0 Group).
KPI Admin
System wide settings
Add Admin > KPI to manage system wide KPI module related settings.
Currently only one parameter to be managed: #KPI Earliest Date.
KPI Earliest Date
Defines cut off date for CT records based on Created on date. Records created earlier than this date will not be used in KPIs.
User specific settings
Note that currently we have some sort of admin. This is re-design.
- On internal users with role=Client will be set up by Jag operators to get access to some KPIs.
- We need to have list of all KPIs available in the system be present in this UI.
- Also we should be able to enable KPI just for some MOTs.
- Need enable/disable drill down switch per user
- Finally many KPIs have "KPI parameters" (such as intervals for Gages). They should be set through this Admin as well.
- As far as layout It should have tree like structure:
- KPI class A
- KPI 1
- KPI 2
- ...
- KPI class B
- KPI 1
- KPI 2
- ...
Once some KPIs are enabled these client users should be able to manage enabled KPIs in their users profiles.
Misc Standards
Shipment defined
Shipment is by definition:
- in case of Truck with TMS it is a "TMS load"
- in all other cases it is:
- a group of CTs (if GRP exists) or
- individual CT (if it is not a part of a group)
MOTs
Use all MOTs.
If there is no data for given MOT - do not show it in selector.
Mappings
Shippers:
- same for all MOTs
- maps to Ct#Shipper
Consignees:
- same for all MOTs
- maps to Ct#Consignee
Carriers:
We have two fields for Trucking company: Export Pick-up Trucker, Delivery Trucker. 'So if one shipment has both fields set then I assume both companies get credit as far as shipment count and weight.' THIS NEEDS TO A NEW SOW !!!!
Lanes:
- Ocean = origin/destination terminals
- Air = airport of departure / airport of arrival/destination
Association Inclusion and Group logic
#SOW 53 Association Inclusion and Group logic
Parameters used in KPIs
Cost
Calculated as a sum of all sales invoices minus credit notes amounts across all CTs.
Exception is TMS case: in this case cost comes from TMS with loads.
this formula will change! - see #SOW 52 Cost v2.
Gross Weight
Calculated as a sum of Gross Weights of individual CTs.
Drilldowns v2
This is a 2nd attempt to define and describe this feature with sufficient level of details. Particularly 1st version of spec did not have details about xls format and a list of fields to be selected for inclusion.
Drilldown is a functionality that gives "GRP/CT/Commodity item level details" for particular segment of visual representation for given KPI.
Defined for:
- selected time frame (week/month/quarter/year) defined on Left Panel
- same data but restricted to specific Shipper/Consignee/Carrier/Lane(Bottom Right Panel)
Produce pop-up where user can select output fields from this list - see below.
HTML view
No need to show html view first (change!).
List of fields and Field Selection Pop Up for Drilldown
Standard list of fields for all KPIs:
CT attributes (all KPIs):
-------------------------

GRP#(Load#)
CT#
Shipper
Created On Date
Authorized Date
Act. Pick Up date
Act. Delivery
* Created by
Pick Up Location
Ship To Location     // map to TO BE CARIFIED!!!
P.O. Issued by
Pick Up Instructions
Commodity Description
Cargo Available
Cargo Due date

* Planner Name
* Approved by (planner)
* Approved by (super planner)
* Pick up country
* Delivery country
* Pick up region
* Delivery region

Shipment TTL GW (lb)
Shipment TTL GW (kg)
Haz
Pick up Trucker Name
Est. Pick Up date
Delivery Trucker Name
Est. Delivery
Created by
Authorization Status
Last Update Date
Last Update by

MOT
Created On
Approved On
Approved For
Rejected On

Load attributes:
-------------
Load#
Date of receipt
Total charge
Other charges

Commodity table attributes (all KPIs):
--------------------------------------

P.O.
SKU
Qty
Piece Price
Total Value
Item Description
# Plt
Pkgs on plt
Loose pkgs
Stack
TTL GW (lb)
TTL GW (kg)
* TTL Chargeable weight (AIR mode only)
* Total CBM (LCL Mode only)
* Total Freight Costs (with OR without DUTY/VAT)

KPIs
----
* Current KPI
* For “counters” we need “created to delivered”
* For CPU we need “created to delivered” and “approved to due date” and “picked up to delivered” and “average transit time”
* For Lead times we need “average cost per KG” and “average cost per item”
Changes: all fields with *
Misc Field Selector pop up logic
- 1/ Use diff font or color to show commod items vs shipment items vs load items or postfix items with "Shipment fields", "(commod field)", "load field" to indicate.
- 2/ list sections one after another (CT fields, Commod fields, etc)
- 3/ Above is one list (change!) with items in alphabetical order (per section).
- 4/ Use drag and drop to select (change!)
- 5/ Default value for “downloads” should always be:
- GRP# or load# for TMS
- CT#
- Shipper
- PO
- SKU
- QTY
- current KPI field
- 6/ make GRP#(Load#) and CT# first 2 firlds required and always leftmost
- 7/ Add these buttons/fetures:
- Save - saves current list of selected fields. Will be used as a default for THIS user in all KPIs from now on
- Reset - reset above to Systems default
xls format for drill downs
Header
- A the top print title in large bold that consists of: <KPI class name> + " KPI"
- example:
Cost per Unit KPI
- below - list KPI name and number of shipments
- example:
KPI name: Cost per Kg
Num of shipments: 12
- below - all additional conditions as defined by filters
- example
Client Company: EA
Mode of Transport: Air
Timeframe: 01-30 Jan 2013
Shipper: Elmar
- below - additional info
- example
Currency: USD
Body

- 1/ See mock up above.
- 2/ Each line represents commodity line.
- 3/ If value is CT based then post into first commodity line of first CT in GRP (example: CBM)
- 4/ Post "n/a" if no value is defined (example: CBM)
- 5/ In some cases opers do not enter all info
- Case 1 - when all commodity line info is entered by oper
- Case 2 - when Oper enters only totals on one (normally first line).
- 6/ Fill in all cells with values even in case they repeat (common values for all commode lines). For example Shipper value will repeat for all commode lines.
- 7/ the currency / total currency should be downloaded into a ‘currency’ format without the need to manually change the formatting of these cells
Group and Load Logic
In case of Truck TMS replace GRP# with Load#.
Cost Per Unit KPI Class
This is aka CPU.
CPU General Info and List
a. Cost per Lb
b. Cost per Kg
c. Cost per Item
d. Cost per Pallet
e. Cost per Carton
f. Cost per chargeable Weight (air)
g. Cost per container (FCL)
h. Cost per CBM (LCL)
CPU group A
Cost per Lb
This is average cost per pound.
Formula: #Cost / #Gross Weight.
Cost per Kg
This is same as #Cost per Lb but using different unit of measurement.
CPU group B
Cost per chargeable weight
- This is for MOT Air only
- Formula: #Cost / (sum of all chargeable weights across all CTs participating)
Cost per CBM
- Formula: #Cost / (sum of all CBMs across all CTs participating)
- MOT = LCL only
CPU group C
Cost per Container
'!!! This is on hold
Spec to be rewritten
- OLD Formula: #Cost / (sum of all container counts across all CTs participating)
- not important what cont type
- MOT= FCL only
Cost per item
Formula: #Cost / (sum of Qty values from CT commodity table across all CTs participating)
Cost per Pallet
Formula: #Cost / (sum of all pallet counts across all CTs participating)
Cost per Carton
Formula: #Cost / (sum of all carton counts across all CTs participating)
CPU Layout
See #Standard Layout.
Also see #KPI Framework.
DR3 Phase 1A: EA DOM Portal only
Commented out this spec as outdated.
Dates KPI Class
Dates KPI General Info
- Name "Lead times" (aka Dates)
- Measuring average per CT distance in days between known CT dates.
List of Dates KPIs
See below links to group A, B, C, .... .
Dates KPI group A
- created to delivered *
- approved to delivered *
- created to approved *
- approved to pick up *
- pick up to departure (air and ocean only)
- departure to arrival (air and ocean only) - moved to group B !!!
- arrival to delivery (air and ocean only)
- pick up to delivery
Dates KPI group B
On time performance
1/ Definition: Difference in days between Cargo Due and Actual Delivery Date.
2/ label: OTIP
3/ MOT: all
4/ This KPi is for ONLY ASN records that have DUE DATE
Departure to Arrival
1/ Definition: Difference in days between Actual Departure and Actual Arrival Date
2/ label: Departure to Arrival
3/ MOT: air and ocean only
Approved on Date to Cargo Due Date
- Meaning: Number of days since the date of the shipment gets approval to the date of cargo due date
- Show label as: Approved to Cargo Due
- Only for ASN users and TMS Client user roles
- formerly SOW 29
Dates KPI group C
Created on Date to Cargo Due Date
- Meaning: Number of days since the date of creation of the shipment to the date of cargo due date
- Show label as: Created to Cargo Due
- Only for ASN users and TMS Client user roles
- formerly SOW 29
Basic to Super approved
- Add additional lead time date range to measure time for shipment to get approve by double approval process.
- Meaning: This is measuring between a date that basic planner approves shipment and a date that super planner approves shipment
- Show label as: Basic to Super approved
- If there is some shipment that only got approved by super planner, DO NOT consider this shipment. Only consider shipments that have approval activity from both basic planner and super planner
- Only for ASN users and TMS Client user roles
- formerly SOW 31
Average Transit Times KPI
- Transit in days:
- Truck: door to door in days
- Air: airport to airport
- Ocean: port to port
- Label: Transit Times
- formerly 3966
Time To Update
- Meaning: number of days between date that is set and date on which this date is set by operator. For these date field:
- Actual Pick Up
- Actual Delivery
- If date was updated in advance (before that date) then show KPI value as negative, if on same day then show as zero, if updated after then show as positive
- Show label as:
- Time to update <date field>
- formerly SOW 30, mant 3752
Dates KPI group D
File Closing Metrics
- type: Internal KPI
- name: Arrived to Closed
- meaning: number of days from actual arrival date (delivery for Truck modes) to date of closing (of that CT)
- Add filters to main menu
- By office (associate CT with office through operator that closed that CT last time)
Dates KPI Title
Lead Times by Shipper Consignee Carrier Lane.
Dates KPI Main Menu
- MOT
- specific dates KPI
Dates View KPI panel
- gives average in days for
a YTD for selected dates KPISee SOW 1 - gives change in %
(this year over previous)See SOW 1 - arrow indicator
(up or down from previous year)See SOW 1 - gage indicator for
YTDSee SOW 1 - weekly/monthly switch - this actually currently controls type of axis X on Top Right panel
Dates KPI Left panel
See #KPI Framework
Dates KPI Top Right panel
See #KPI Framework
Dates View Bottom Right panel
See #KPI Framework
Counters KPI Class
IMPORTANT: see also #Association Inclusion and Group logic
Counters General Info
This is a class of KPIs. Individual KPIs that belong to this class - see below.
Group One (free client KPIs):
Group Two (others):
- Gross KG shipped
- Cartons count
- Pallets Count
- CBMs count
- Containers Count
- Chargeable Weight Count
Another name for this KPI class is "Volumes".
Counters group A
Shipments Count
In case of Trucking MOT with TMS:
- it is a number of loads.
For all other cases/MOTs:
- it is all GRPs plus individual CTs not included in GRPs that were created during given timeframe for given MOT. Use "Created On Date".
See also #Shipment defined.
Note: Created On Date for a group is Created On from CT with lowest CT number in the group.
CT Count
- it is 'a sum of all CTs that were created during given timeframe for given MOT. Use "Created On Date".
Total Spend
Trucking for TMS/EADOM case:
- Total charges for all loads for given timeframe (from LoadPlan XML).
All other cases/MOTs:
- take sum of all sales invoices
Additional condition:
- consider only shipment that has Actual Delivery date is set (not empty).
see also Exclude Duty and VAT section
Main Menu
- Client company
- MOT - Single select including ALL MOTs
- Default: All MOTs
- If mode is selected then applies to left panel, top right panel and bottom right panel for a particular mode value
- Specific couters KPI - Shipment count/Gross KG/Cartons count/Pallets count...dropdown menu
- This specific counter KPI - single select, if it is universal, shows all modes for default value, if it is specific, shows mode specific.
View Type
Layout
Use #Standard Layout similar to Cost per unit KPI
Counter View Title
Activity KPI by Shipper Consignee Carrier Lane
KPI Panel
- Label: ie. Total shipments (KPI type of counters- See List of total counters KPI above)
- Number: Actual value of KPI (NOT average value of the last full week/quarter/month)
- Arrow change indicator: Same indicator as other KPIs
- Percentage: comparatively to previous period time frame same as other KPI
- Timeframe: Options: Weekly, Quarterly, Monthly
- Traffic light: Gage. Indicates tolerance level same as other KPIs
- Weekly/Quarter/Monthly switch: Control type of axis X on Top Right panel
Left Panel
Similar to Cost per Unit KPI but this is reported on selected type of counter KPIs
Include Drill down concept and ability to download to excel
- Types of counters are universal for all MOTs or specific for specific MOT.
- Universal KPI: default "ALL MOTs" and value for all modes (count all modes)
- Specific MOT: default to specific "MOT" (count on a specific mode such as CBMs count is specific for LCL only)
For specific MOTs show specific MOTs value
Top Right Panel
Similar to Cost per Unit KPI but this is reported on selected type of counter KPIs
All MOTs as selected choice by default
- show graphs for all modes for current year and last year comparison
Specific mode is selected
- show graphs for a specific mode
Bottom Right Panel
Similar to Cost per Unit KPI but this is reported on selected type of counter KPIs
Include drill down concept with HTML report and ability to download to excel
- This chart is to show for all modes if all modes is selected. Show only a specific mode if specific mode is selected. Current YTD value.
Apply to panels
Apply to all panels (top right, bottom right, left panel) with KPI and MOT values combination.
LO and EU KPI classes
LO class
- name: "Lane Optimization"
- has one KPI #Shipments per Lane - see below
Shipments per Lane
- label: "Shipments per Lane"
- definition: This shows how many shipments for every lane
- main menu: Add Lane selector
- Lane is defined as #Lane
- mock up - see below:
- !!! There is 0004126: KPI Menu v2 task that would affect mock up below

EU class
- name: "Equipment Utilization"
- This is a KPI measuring quantity, weight in Kg and Lb, pallets, CBM, etc per shipment/ per container for a specific time frame
- group A:
- group B:
- #Pallets per container - on hold as well
- #CBM per container - on hold
- Layout: #Standard Layout
KG per shipment
average KG per shipment(load for Truck Dom TMS, master for Non-TMS Trucking) for specific time frame. Sum up KGs for all shipments in a specific time frame and divide by number of shipments
LB per shipment
average LB per shipment(load for Truck Dom TMS, master for Non-TMS Trucking) for specific time frame. Sum up Lbs for all shipments in a specific time frame and divide by number of shipments
Pallets per shipment
average Pallets per shipment(load for Truck Dom TMS, master for Non-TMS Trucking) for specific time frame.
Sum up number of pallets for all shipments in a specific time frame and divide by number of shipments
CBM per shipment
average CBM per shipment(load for Truck Dom TMS, master for Non-TMS Trucking) for specific time frame.
Sum up CBM value for all shipments in a specific time frame and divide by number of shipments
Chargeable Weight per shipment
- Average for Chargeable Weight across participating CTs
- MOT Air only
Pallets per container
average plts per container for specific time frame. Sum up number of pallets for all number of containers in a specific time frame and divide by number of containers
CBM per container
!!! Per Marc Keep ON HOLD for International ASN Clients
average CBM per container for specific time frame. Sum up CBM value for all number of containers in a specific time frame and divide by number of containers
Misc
N/A
SOWs Part A
Sequence
- first 3567, 3575 in parallel
- next 0003583
- next 0003595
- all remaining are sequential in order of priorities
3567 DR1 Simple Shipment count DR
- Sasha: Java/SQL
Spec: #DR1 Simple Shipment count DR
3575 Evaluate LogiXML
- Kostya, Vlad
0003583 DR2 Complex Shipment Data per Client per Year DR, PART A
- kostya: SQL, Java b-end
- sasha: b-end, f-end
spec: #DR2 Complex Shipment Data per Client per Year DR, PART A
0003595: [DR/KPI] DR3 Phase 1A: EA DOM Portal only
spec: #DR3 Phase 1A: EA DOM Portal only
SOWs Part B
SOW 0 DR4 Dates KPI
mantis: 3662
Spec: #DR4 Phase 1A2 Dates View
- Created to Delivered
- Approved to Delivered
- Created to Approved
- Approved to Pick-up
- Pick up to Delivered
SOW 1 Spec gaps and some changes
mantis: 3668
R1,2 - moved to another SOW
- R3: monthly / weekly switch should also apply to Left Panel (group by weeks / month). If monthly is selected then left panel should show breakdown by month
- R4: for Left panel:
- arrow indicator should show change from previous week SAME year not previous year
- R5: for KPI panel:
- arrow and percentage: implement as in original spec (last week/month comparatively to previous week/month)
- R6 (added): for KPI panel:
- Number should show average cost per unit for last week/month (not YTD)
Description for R4, R5, and R6.
- 1) Left Panel: Show data until latest week/month which includes current week/month.
ie. if today is Thursday July 19 (29 Week). Top left should show 29 weeks for weekly left panel.. See SUMMARY section below.
-
2) KPI Value: <s>Per Example above, current week (29)/month (July) is not a full week/month,
-
KPI value should show the the last week/month value and percentage of last week/month value compared to previous week/month.
ie. If monthly is selected, shows July data on the left panel as the latest month (current month) and KPI Value shows "Jun KPI value " and percentage "Jun KPI" compared to "May KPI".
ie. If weekly is selected, shows 29 week on the left panel as the latest week (current week) and shows KPI value for last week value "28 week KPI value" and percentage "28 week KPI" compared to "27 week KPI".
Additional changes from above requirements:
Left Panel:
- 1) Show the latest of full week/month on the list (do not show current not full week/month value)
- a. For example, today is Tuesday July 24 (week 30), show last full week/month as the first one on the list (week 29, Week 28, …/Jun, May). Not necessary to show week 30/July as they are NOT a full week/month.
- 2) For Weekly/monthly that has “0” value (no data), do not show arrow change indicator for the week/month that has no data(empty)
- 3) If there is some week period in the middle that has no data (between 2 period of weeks that have data), arrow indicator to show for the week/month that has data compared to the previous last full week that has data
KPI Panel:
- 1) Show the last full week KPI value:
- a. If the last full week value has no data (empty), show “0” as KPI value as well as percentage for “0%” and no need to show arrow change indicator
- b. If the last full week value has data (not empty) and the previous week has no data (empty) then KPI value shows for the last full week value, and % for comparison as well as arrow change indicator to compare between the last full week (not empty) and previous last full week that has data (not empty)
Note: APPLY THESE TO ALL KPIs
Signed off by Marc for these additional changes with more note below:
This is correct. Also on the “timeline linechart” simply skip the weeks where there is no data so the lines will not be continuous from left to right but will only connect weeks that have data.
- Empty week = empty
- Full week = dot
- Empty week = empty
In the above example 3 weeks with 2 weeks (1 and 3) do not have data = only 1 dot on the chart.
- Full Week = dot
- Full Week = dot
The above 2 dot are connected by a line.

Summary of this SOW1 can be found on mantis attachment.
SUMMARY
- 1) Monthly / weekly switch should also apply to Left Panel (group by weeks / month). If monthly is selected then left panel should show breakdown by month.
Left Panel:
- Show the latest of full week/month on the list (do not show current not full week/month value)
- Arrow indicator should show change from previous week SAME year not previous year
- For Weekly/monthly that has “0” value (no data), do not show arrow change indicator for the week/month that has no data(empty)
- If there is some week period in the middle that has no data (between 2 period of weeks that have data), arrow indicator to show for the week/month that has data compared to the previous last full week that has data
- 2) KPI Value:
- Arrow indicator should show change from previous week SAME year not previous year
- Arrow and percentage: implement as in original spec (last week/month comparatively to previous week/month)
- Number should show average cost per unit for last full week/month (not YTD)
- Show the last full week KPI value:
- If the last full week value has no data (empty), show “0” as KPI value as well as percentage for “0%” and no need to show arrow change indicator
- If the last full week value has data (not empty) and the previous week has no data (empty) then KPI value shows for the last full week value, and % for comparison as well as arrow change indicator to compare between the last full week (not empty) and previous last full week that has data (not empty)
- 3) Top Right Panel
- Timeline line chart
- If there is no data, no dot on graph (skip the weeks where there is no data)
- If there is data, dot on graph and connect it to the last dot on graph
- Timeline line chart
SOW 2 Look and feel changes
mantis: 3690
- Weekly/monthly button: not clear what indicates "pressed" state

SOW 3 KPI Admin on Internal and Client
mantis: 3691
spec: #KPI Admin
SOW 4 (DR3 Cost Per Unit KPI, EA DOM only) Add all other Views
manis: 3692
These views:
- Shippers View
- Consignees View
- Carriers View
- Lanes View
Spec: #DR3 Cost per unit KPI by Shipper Consignee Carrier Lane
SOW 5 Add Quarters
mantis: 3693
Add option Quarterly to Weekly / Monthly
- Quarterly button is added between Weekly and Monthly
- Left Panel:
- Once Quarterly is selected then quarterly data columns are applied
- Show Quarterly from latest full quarter back to previous quarters (Q2 Apr-Jun 2012, Q1 Jan-Mar 2012, Q4 Oct-Dec 2011, ....)
- Show KPI value per quarter
- Drill down value: see #SOW_10_Left_panel_drill_down
- KPI Panel:
- KPI value: last full quarter value and percentage compared between last full quarter value and previous last full quarter value (not empty: Must have data)
- Top right Panel:
- Axis X: Quarters (Q1, Q2, Q3, and Q4)
- Axis Y:
- Plot A: KPI for this year
- Plot B: KPI for last year
- Plot C: YTD average
- Drill down Left Panel:
- If Q2 Apr-Jun 2012 is selected (one click), then applies chart to the specific quarter value on the bottom right chart.
- Drill down for a particular bottom right chart, show HTML report information for that particular bar/pie chart with ability for download to excel select output option
- If Q2 Apr-Jun 2012 is selected (double clicks), then download to excel option is available for all data for that particular quarter 2.
- If Q2 Apr-Jun 2012 is selected (one click), then applies chart to the specific quarter value on the bottom right chart.
SOW 6 Cost per pound is incorrect for some records
mantis: 3688
Current issue:
- The current KPI module calculates cost KPIs based solely from the TMS load table (tblLoad). This poses an issue for us as the TotalWeight in that table is pulled directly from TMS and for the most part the TotalWeight in that table is incorrect. Some records contain only 1 lb on weight when they first created CT record for Truck itself. Issue is due to a specific business process that the EA Dom team uses for all east coast northbound/southbound full trailer consolidation moves. Weight and piece counts are not known in advance and are usually known the morning after, when trucker, Lawrence Transportation, provides EA Dom with a trailer manifest. This manifest confirms the actual shipment #'s that were loaded into the trailer and its corresponding TMS Load number#.
- These type of records cause report on Cost per lb/kg incorrect as the info we report is not a correct report on weight. The weights get updated later on CyberTrax but it does not send back to TMS. The up to date weights can be seen on CyberTrax.
Strategic Solution:
- Redesign KPI module to calculate cost KPIs by using the TotalCharge in load table and combining/aggregating TotalWeight from internal CT2 tables. TotalCharge is to be used for load or add up allocated charge in the loadplan to be used for load charges.. Allocated charge in the loadplan is to be used for CT record.
- Drill down: Export to excel - Ensure that there should be ability to report cost per lb/kg per load as well as per CT record if the user would like to.
See Allocated charges for each CT on LoadPlan: Allocated Charges for each CT.

SOW 7 Remove pick up and/delivery trucker switch and display for only Pick up data
mantis: 3719
Business process currently, there are 3 different use cases of CT records in CT2 system with Pick up and Delivery truckers assigned below:
- 1. CT1 - Shipment that has Trucker 1 as a pick up trucker and Trucker 1 as a delivery trucker and charges applies to Trucker 1
- 2. CT2 - Shipment that has Trucker 2 as a pick up trucker and Trucker 2 as a delivery trucker and charges applies to Trucker 2
- 3. CT3 - Shipment that has Trucker 1 as a pick up trucker and Trucker 2 as a delivery trucker and charges applies to Trucker 1
For case 3, even though a shipment has 2 truckers to handle the shipment but the charge is always applied to the pick up trucker only. For the delivery trucker charges, operator has to create a new CT internally in this case could be CT4- shipment to handle the charges for Trucker 2 for CT3. Operator creates CT4 - shipment that has trucker 2 as a pick up trucker as well as deliver trucker and charges applies to Trucker 2
- 4. CT4 - Shipment that has Trucker 2 as a pick up trucker and Trucker 2 as a delivery trucker and charges applies to Trucker 2 (handle charges for CT3 delivery trucker)
Notes: This is only applied for Truck- DOM for TMS only

SOW 8 For Bottom Right panel add drill down to CT and load level
mantis: 3707
spec: #MV Bottom right panel drill down
SOW 9 Show all data from KPI Earliest Date
mantis:3695
Everywhere (all panels, all KPIs) use data from CT records created not earlier than #KPI Earliest Date. Based on "Created On Date".
Managed through Admin.
Currently defined as Jan 1, 2011 and hardcoded.
SOW 10 Left panel drill down
mantis: 3703
Left Panel Drill down ability should be applied and available for all KPIs
spec: #MV Left panel drilldown
SOW 11 DR4 Dates KPI (On time performance: Truck dom (TMS) only )
Mantis: 3712
- Add additional lead time date range to measure On time performance
- Meaning: How on time between Actual date of delivery and Cargo Due date.
- Goal: To measure how on time performance will be and percentage on time, late, and early. The goal for user to achieve is to get number that is close to or equal to "zero" or "negative" value; means "On time" or "Early" in business performance.
- 1) Average days for on time performance
- Logic 1: Day(s) = Actual Delivery Date - Due Date
- Day(s): Negative = Early, Positive = Late, Zero "0" = On time
- Logic 2: Average of performance for shipping = SUM (Day(s) in a week/quarter/month) / CT Count.
- Result of KPI value for average days comes from sum up number of days from logic 1 for all CTs within a week/quarter/month then divided by number of CT records within a week/quarter/month.
- If the day value is positive; means average of performance for shipping is considered late
- If the day value is negative; means average of performance for shipping is considered early
- If the day value is equal zero; means average of performance for shipping is considered On time
- Logic 1: Day(s) = Actual Delivery Date - Due Date
- 2) Percentage on time/late/early in particular week/quarter/month/YTD current year
- Logic 3: Percentage of delivery shipment early in particular time frame = Number of CT record(s) that is early / Total number of CT records in particular time frame
- Logic 4: Percentage of delivery shipment late in particular time frame = Number of CT record(s) that is late / Total number of CT records in particular time frame
- Logic 5: Percentage of delivery shipment on time in particular time frame = Number of CT record(s) that is on time / Total number of CT records in particular time frame
- 1) Average days for on time performance
- MOT: Truck-Dom (TMS)
On average these shipments are delivered before Cargo Due date is considered Early , on the Cargo Due date is considered On time and for shipments that are delivered late or after Cargo Due date is considered Late
Additional info from Leadtime KPI
- Option: Additional date pairing to measure on time performance
- 2 additional options from drop down list
- OTIP (Day)
- OTIP (%) - make it default option for Lead Time KPI.
- 2 additional options from drop down list
- Additional tab for CT count to bottom right chart
Layout
Use #Standard Layout similar to other date KPIs
KPI Panel
- Label:Average (days)
- Number: Average value of the last full week/quarter/month
- Arrow change indicator: Same indicator as other KPIs
- Percentage: Comparatively to previous period time frame same as other KPIs
- Timeframe: Weekly, Quarterly, Monthly
- Traffic light: Gage. Indicates tolerance level same as other KPIs.
- Weekly/Quarterly/Monthly switch: Control type of axis X on top Right panel
Left Panel
Similar to other date KPIs. The difference is the value can contain negative value if shipment is delivered early, zero value if shipment is delivered on time, and positive value if shipment is delivered late.
Include Drill down concept and ability to download to excel. Similar to other dates drill down functionality.
Top Right Panel
Similar to other date KPIs. The differences are:
- OTIP (Day )
- Show average (days) on axis Y, and timeframe on axis X depend upon time frame switch
- OTIP (%)
- Show average % on axis Y, and timeframe on axis X upon time frame switch
Bottom Right Panel
Similar to other date KPIs with additional tab for CT count as to show percentage of shipments that are delivered early, on time and late. Show YTD current year average value.
Include drill down concept with HTML report and ability to download to excel
CT count Tab
Axis Y is CT count, Axis X show max 25 value from negative to positive value. Depend on value in the system. Show 25 value on axis X then the first position shows (Less than negative value), the last position shows (More than positive value), the middle position shows (0) value for on time.
Show % on the charts
Other tabs
Shippers, Consignees, Carriers, Lanes similar to other date KPIs.
OTIP (Day)

OTIP (%)

SOW 12 Elevate 0 value graph in order to see a bar chart for zero value
mantis: 3705
- Zero value chart is not visible (blank) and value cannot be shown while mouse over value
- Elevate 0 value graph in order to see actual bar charts for zero value. Apply for all tabs for zero value
- See figures below:

Solution: elevate zero value to show actual zero value chart below

SOW 13 DR3 Cost per Unit (cost per LB and cost per KG for all modes)
Mantis: 3795
- These cost per LB and per KG apply to all modes. This is universal for all modes just a conversion
SOW 14 Add Yearly as well as make button narrower and rename buttons
Mantis: 3737
Add option Yearly to Weekly / Quarterly / Monthly
- Yearly button is added after Monthly
- Rename buttons: Weekly/Quarterly/Monthly/Yearly to Wk/Qtr/Mo/Yr
- Left Panel:
- Once Yr is selected then yearly data columns are applied
- Show Yearly from latest full year back to previous years (2011, 2010)
- Show KPI value per year
- Drill down value: see #SOW_10_Left_panel_drill_down
- KPI Panel:
- KPI value: last full year value and percentage compared between last full year value and previous last full year value (not empty: Must have data)
- Top right Panel:
- Axis X: Years (2011,2010) If current year is 2013 but not a full year then show 2012, 2011, 2010
- Axis Y:
- Plot A: KPI for this year
- Plot B: KPI for last year
- Plot C: YTD current year average
- Plot D: YTD last year average
- Drill down Left Panel:
- If year 2012 is selected (one click), then applies chart to the specific year value on the bottom right chart.
- Drill down for a particular bottom right chart, show HTML report information for that particular bar/pie chart with ability for download to excel select output option
- If year 2012 is selected (double clicks), then download to excel option is available for all data for that particular year.
- If year 2012 is selected (one click), then applies chart to the specific year value on the bottom right chart.
- Left Panel:
SOW 15 Change status bar value display
Mantis: 3735
- DisplayActual KPI Value on status bar so that user can see all the value all at once as user can view it quickly compared to use mouse over value one by one to compare one by one.
- No need to show the min, med, max value on the status bar (hide)
- Mouse over value functionality should stay the same as common.

SOW 16 Connect dot timeline chart
Mantis: 3736
- Design Chart 2
- This is a requirement from SOW 1, but it was not enough time to implement. Need more time to investigate at that time, so this SOW 16 is created for this task separately.
SOW 19 DR7 Overlap
canceled
SOW 20 DR3 Cost Per Unit KPI: Extend this KPI to other Client Companies
mantis: 3798
Detailed spec TBD!
SOW 21 Top Right Panel: Show all years graphs since May 2010 with all YTD average
Mantis: 3708
- Data is displayed from May 2010 for all KPIs
- Graphs: 2012, 2011, 2010, YTD average (2012), YTD average (2011), YTD average (2010)
- Provide ability to easily select years for comparison (2 years at a time)
- Default: Show the current year and last year graphs (2012, YTD 2012 average, 2011, YTD 2011)
- Same year same color of graph but different type of graph to show the different. Current one is good for dot graph with line for a year and dash-line graph for a YTD average.
SOW 22 Bottom Right Panel: Spell out what value based on
Mantis: 3709
Bottom Right Panel displays bar or pie segment chart for top/bottom display value but there is nothing to describe what those value on the graph based on such as 2012 YTD value or weekly for current year value, or value of all data in the system.
- Display a Frame Label for what value based on to help user understand what data he/she see and compare to.
- A Frame label must be displayed for all KPIs and all views for the bottom right panel
- Main view: such as 28 Week (08-14 Jul 2012, 2th Quarter (Apr-Jun 2012), 2012 YTD Average
- Other views: such as Weekly - 2012, 2012 YTD Average
- A frame label displays depending upon general information or Left Panel drill down information
SOW 23 (DR3 Cost Per Unit KPI) Extend this KPI to other MOTs (all units)
Mantis: 3799
Extend cost per unit KPI from existing one to other mode of transportation as well as other cost per unit (all units)
- These list of DR KPI is on cost per unit tab additional to cost per Lb.
- Dropdown list for list of cost per unit KPI
- Universal for all MOTs
- Cost per Lb
- Cost per Kg
- Cost per Item
- Cost per pallet
- Cost per carton
- Universal for all MOTs
- Specific MOT(s)
- Cost per Chargeable Weight - specific for Air only
- Cost per container - specific for Ocean FCL only
- Cost per CBM - specific for Ocean LCL and Vendor Console
- Specific MOT(s)
- All units are added to this KPI and are available for ones that applies to mode of transportation.
- Meaning: Universal list of cost per unit MUST be available for all MOTs selected and some specific one is available for specific mode of transportation.
- It is available when cost per unit is set to be available to specific user and allow user accessibly to my profile (Client Application) for tolerance Gage setting for specific cost per unit.
Truck
- Once this MOT is selected then list of cost per unit that applies to Trucking will be available: Universal list
- Truck Air, Truck Ocean, Truck Dom (TMS), Truck DOM (NON-TMS)
- For the TMS shipments, consider Load shipments - CT level
- For the NON TMS shipments, consider Master shipments - CT level
Air
- Once this MOT is selected then list of cost per unit that applies to Air will be available. In this case universal list will be available as well as cost per chargeable weight
Ocean FCL
- Once this MOT is selected then list of cost per unit that applies to Ocean FCL will be available. In this case universal list will be available as well as cost per container
Ocean LCL
- Once this MOT is selected then list of cost per unit that applies to Ocean LCL will be available. In this case universal list will be available as well as cost per CBM
- This one consider both ocean LCL and Vendor console
Question to Marc: Whether we will look at mode of transportation option to Air Ocean and Truck? or Air Ocean FCL Ocean LCL, Truck (include for both truck dom (TMS) and Truck ocean and Truck air (non-TMS)
Question to Marc: Whether we look at ct level for all TMS and NON-TMS ???
- Main View and other views.
Layout and Cost per unit view title
Use #Standard Layout same as Cost per unit KPI with drop-down list of cost per unit
KPI Panel
- Label: Cost per Lb, Cost per Kg,... etc depend on what cost per unit is selected
- Number: Average value of cost per unit of the last full week/quarter/month and depend on what cost per unit is selected.
- Arrow change indicator: Same indicator as other KPIs
- Percentage: comparatively to previous period time frame same as other KPIs
- Timeframe: Options: Weekly, Quarterly, Monthly
- Traffic light: Gage. Indicates tolerance level same as other KPIs
Logic
Cost per Lb:
Cost per Kg:
Cost per Item:
Cost per Pallets:
Cost per Carton:
Cost per Chargeable Weight:
Cost per CBM:
Cost per container:
Left Panel
Similar to cost per Lb but this is reported on what unit is selected to show average result
Include drill down concept and ability to download to excel
Top Right and Bottom right panel
Similar to cost per Lb but this is reported on selected type of cost per unit to show average result
Include drill down concept with HTML report and ability to download to excel
Apply to panel
Similar to cost per Lb
Main View
See an example mock up for cost per Kg below. Other unit has similar mock up only report on different of unit for cost

SOW 24 (DR4 Lead Time KPI) Extend this KPI to other MOTs (all units)
mantis: 3800
- Air
- Ocean
- LCL/FCL/Vendor Console
- Truck
- Truck-Air
- Truck-Ocean
Detailed spec TBD!
SOW 25 (DR5 Total counter KPI) Extend this KPI to other MOTs (all units)
mantis: 3801
- Air
- Ocean
- LCL/FCL/Vendor Console
- Truck
- Truck-Air
- Truck-Ocean
Detailed spec TBD!
SOW 26 DR5 Total counter KPI : Extend this KPI to other views
Mantis: 3802
- Shippers View
- Consignee View
- Carriers View
- Lanes View
SOW 27 (DR6 Lane Optimization Equipment Utilization) Extend this KPI to other MOTs (all units)
mantis: 3728
- Air
- Ocean
- LCL/FCL/Vendor Console
- Truck
- Truck-Air
- Truck-Ocean
Detailed spec TBD!
SOW 28 (DR6 Lane Optimization Equipment Utilization) Extend this KPI to other views
Mantis: 3803
SOW 29 (DR4 Lead Time KPI) Add additional KPIs to measure cargo due date
Mantis: 3741
outdated mantis, moved to another SOW
SOW 30 (DR4 Lead Time KPI) who and when - Updates and Time to update Actual Departure date and Actual delivery date KPIs
Mantis: 3752
Provide ability to track and report on specific CT2 updates and events. Driving factor is that clients want the ability to track the efficiency of their operations team and how up-to-date their system records really are.
Example:
Operators enter in an Actual Delivery date of 8/10/2012 for a shipment. However, they waited 2 weeks to make that update on 8/24/2012. So between 8/10 and 8/24, the system data was stale and invalid.
This specific request is to be able to track and report on when and who updates actual departure dates and actual delivery dates
There are 2 KPIs to be added to the LeadTime class for Trucking only.
1) Updates
- Number of shipments that are updated by:
- TMS (trucker)
- Jaguar operator
- Categorize by shippers, consignees, carriers, and lanes
- Option:
- Report on "Actual Pick up date"
- Report on "Actual Delivery date"
KPI Panel
- Label: CT records
- Number: average value of KPI of CT records (that have Actual picked up date or actual delivery date is set) the last full week/quarter/month)
- Arrow change indicator: Same indicator as other KPIs
- Percentage: comparatively to previous period time frame same as other KPI
- Timeframe: Options: Weekly, Quarterly, Monthly
- Traffic light: Gage. Indicates tolerance level same as other KPIs
- Weekly/Quarter/Monthly switch: Control type of axis X on Top Right panel
Logic
- Count (CTs in the system for each specific time frame that have at least actual picked up or actual delivery date not empty)
- count(CTs that have Actual Picked up date field that was updated by Jaguar)
- count(CTs that have Actual Picked up date field that was updated by TMS)
- count(CTs that have Actual Delivery date field that was updated by Jaguar)
- count(CTs that have Actual Delivery date field that was updated by TMS)
Left Panel
Similar to other date KPI but this is reported on average CT records in the system that have:
- At least Actual Picked Up or Actual delivery date is set.
- Weekly, Quarterly, Yearly
Include Drill down concept (one click) and ability to download to excel (double click)
Top Right Panel
Report on CT records count for Actual Picked up Date or Actual Delivery date (option radio button: report for specific date) that were updated by Jaguar and TMS for weekly/quarterly/monthly of current year only (2012)
- Default radio button: Actual Delivery Date
- Graph should show line chart comparison Actual delivery date value that were updated between TMS and Jaguar operator
- If Actual Picked up date radio button is selected then show graph comparison for actual picked up date value that were updated between TMS and Jaguar operator
Bottom Right Panel
Report on CT records Count for YTD current year for CT records in the system that have at least actual picked up date or actual delivery date field set and display stack-chart comparison between records that were update by TMS and Jaguar operator
Include drill down concept with HTML report and ability to download to excel
NOTE: If the left panel is selected for a specific week/month/year then apply the bottom right panel to a specific value per shipper, consignees, carriers, lanes for a specific week/month/year. Ability to report and download to excel for a specific shipper/consignee/carrier/lane for that specific week is available as well. Common to all KPIs for drill down and download to excel functionality.
Apply to panels
Option for date selected for actual pick up and actual delivery dates - apply graph on the Top right panel
Drill down - apply to bottom right panels
Updates

2) Time to update
- Number of days for the actual date to take for the field to be updated (actual date to date to update)
- a) Measure the actual picked up date and the actual date that this field is updated for current year, last year, YTD current year average, YTD previous year average
- b) Measure the actual delivery date and the actual date that this field is updated for current year, last year, YTD current year average, YTD previous year average
- c) Measure both dates average for the actual picked up and delivery dates that that 2 fields are updated for current year, last year, YTD current year average, YTD previous year average (All)
- Categorize by shippers, consignees, carriers, and lanes
- Option:
- Report on "Actual Pick up date"
- Report on "Actual Delivery date"
KPI Panel
- Label: Average (days)
- Number: average days of KPI of combination of time to update for picked up date and actual delivery date OR average days of KPI of time to update Actual picked up date OR average days of KPI of time to update Actual delivery date for the last full week/quarter/month. Depend upon radio button on the right panel.
- Default value: average value of KPI of days for ALL (both actual pick up and delivery dates) in the system
- Arrow change indicator: Same indicator as other KPIs
- Percentage: comparatively to previous period time frame same as other KPI
- Timeframe: Options: Weekly, Quarterly, Monthly
- Traffic light: Gage. Indicates tolerance level same as other KPIs
- Weekly/Quarter/Monthly switch: Control type of axis X on Top Right panel
Logic
- Time to update (days) = Actual Picked up date is set on date by Jaguar - Actual Picked up date value
- Time to update (days) = Actual Picked up date is set on date by TMS - Actual Picked up date value
- Time to update (days) = Actual Delivery date is set on date by Jaguar - Actual Delivery date value
- Time to update (days) = Actual Delivery date is set on date by TMS - Actual Delivery date value
Left Panel
Similar to other date KPI but this is reported on average days of date pairing select based on. If Actual Delivery date is selected, so Left panel show value for average days of how long it takes for actually delivery date to be set compared to the actual delivery date value for particular week/quarter/month. Left panel data depends upon the radio button on the right panel.
Option: All (default), Actual Picked up date, and Actual Delivery date
Each specific time frame considers the records that have at least Actual Picked Up or Actual delivery date is set.
- Weekly, Quarterly, Yearly
Include Drill down concept (one click) and ability to download to excel (double click)
Top Right Panel
Report on average days of Actual Picked up Date, Actual Delivery date OR both the combination of Actual Picked up and Actual Delivery dates for weekly/quarterly/monthly of current year only , previous year, YTD current year, and YTD previous year across the system depend upon option date selected. (option radio button: report for a specific date or ALL)
- Default radio button: All
- Graph should show line chart comparison for current year, previous year, YTD current year average, and YTD previous year average KPI value for specific timeframe.
- If Actual Picked up date radio button is selected then show graph comparison average time to update Actual Picked up date value for current year, previous year, YTD current year average, and YTD previous year average
Bottom Right Panel
Report on average days of YTD current year for actual picked up date or/and actual delivery date across the system depend upon radio button selected from the top right panel
This chart was driven by the radio button on the right panel for Actual Picked up date, Actual Delivery date or ALL. If Actual picked up date was selected then the chart shows YTD current year average days data for Actual Picked up date with stack-chart to separate days for records that were updated by TMS and Jaguar operator.
Include drill down concept with HTML report and ability to download to excel
NOTE: If the left panel is selected for a specific week/month/year then apply the bottom right panel to a specific value per shipper, consignees, carriers, lanes for a specific week/month/year. Ability to report and download to excel for a specific shipper/consignee/carrier/lane for that specific week is available as well. Common to all KPIs for drill down and download to excel functionality.
Apply to panels
Radio button option for date(s) and ALL selected - apply to all :graphs on the Top right panel, left panel data, and bottom right data
Drill down from left panel - apply to bottom right panels
Time to update

SOW 31 (DR4 Lead Time KPI) - how long it takes between Basic planner and Super planner to approve
Mantis: 3765
- Add additional lead time date range to measure time for shipment to get approve by double approval process.
- Meaning: This is measuring between a date that basic planner approves shipment and a date that super planner approves shipment
- Label: Basic to Super approved
- MOT: Truck-Dom shipments that were approved via double approval process only and only consider for the shipments that have both basic planner and super planner approval dates.
Logic:
- Number of days since basic planner approved to super planner approved shipment.
- For example, basic planner approved CT 11111 on Sept 10 and super planner approved this same CT on Sept 12, that means it took 2 days for super planner to approve shipment once basic planner approved.
- Average number of days to take for shipment to get final approve for a specific time frame
- If there is some shipment that only got approved by super planner, DO NOT consider this shipment. Only consider shipments that have approval activity from both basic planner and super planner.
- KPI value, functionality, time frame, drill down, Left panel, Top and Bottom right panels are similar to other date pairing KPIs.
SOW 33 Add Year Selector Panel to the top right panel
Mantis: 3785
Spec: #Year Selector Panel
SOW 34 RFC: change the chart color for bar chart to be one color instead of multicolor
Mantis: 3814
- Blue color would be good. One color is best for bar chart as multicolor do not have meaning associated with it.
- For pie chart, multicolor makes sense. So leave multi-color for pie chart only
- Apply this requirement for all KPIs that have similar display

SOW 35 Lead Time: The vertical lable of top right panel shows "Cost per LB, USD" --> change to "Average Lead Times, in Days"
Mantis: 3840
- “Lead times tab” the Vertical Label of the top/main line graph chart reads “Cost per LB, USD” this should be changed to “Average Lead Times, in Days”

SOW 36 RFC: Cost and Lead time KPI - decimal points
Mantis: 3841
- Change Cost KPI to show 2 decimal point on left panel.
- Change Lead time KPI to show 1 decimal point on left panel.
SOW 37 RFC: Bar's width of top/bottom 5
Mantis: 3842
- Change the width of the columns for "top/Bottom 5" to be a bit bigger that the size as "top/Bottom 10" but smaller than the current one and space them out. Can we make it in between the sizes? 3/4 of the original size?
- Currently it is too wide, so it would look nicer to keep it thinner and space them out.
SOWs part C
By Alex after he took over from Tira
SOW 38 Define and implement user data visibility for KPIs
mantis: 3971
spec: #Visibility
SOW 17 Counters:group A
Mantis: 3964, 3978, 3979
Spec: #Counters group A
Kostya: SQL
Misha: Drilldowns and Admin
Sasha: Front End
SOW 39 Dates KPI:group A
Mantis: 3980, 3981, 3982
Review existing KPIs in this group and make them work as re-defined in #KPI Framework - main changes are visibility and use with all MOTs.
Spec: #Dates KPI group A
Kostya: SQL
Misha: Drilldowns and Admin
Sasha: Front End
SOW 40 CPU KPI:group A
Mantis: 3983, 3984, 3985
Review existing KPIs in this group and make them work as re-defined in #KPI Framework - main changes are visibility and use with all MOTs.
Spec: #CPU group A
Kostya: SQL and Admin
Misha: Drilldowns
Sasha: Front End
SOW 41 Pull weight when calculating KPIs always from CT2 DB
Mantis: 0003987
Spec:
Currently we pull weight in some cases from TMS we need to change that to CT2 DB as this info is more correct (operators will update some records that have incorrect weight coming from TMS).
SOW 32 Add PO Issue By tab
Mantis: 3767
- add to the Bottom Right Panel
- add for all KPIs
- breakdown per PO Issued By
- additional graph on additional tab at the bottom right panel next to lanes and carriers
SOW 43 Counters KPI:group B
mant: 3988
spec:
List: Gross KG; Cartons count; Pallets count; Containers count; CBM count; Chargeable Weight count
Gross KG shipped
- Grand total of Gross KGs for all shipments for specific time frame.
- Gross KG data mapping: CT>TableA.GrandTotal.Ttl GW Commodity#Grand_Total:_Gross_Kg
Package count
(per Marc this is on hold!)
- This counts number of cartons; consider sum(AMS) cartons for all CTs for each specific time frame.
- Mapping: ContTab.Table A. Grand Total AMS
AMS for shipment: (Loose pkgs + Ttl pkgs on plts)
Pallets Count
(per Marc this is on hold!)
- Count number of actual # of pallets for a specific time frame. SUM(Ttl #Plts).
- Mapping:ContTab.TableA.Grandtotal.Ttl # of plts Commodity#Grand_Total:_Plts
Containers Count
- total TEU value for shipment
- include only assigned containers
- label: TEU
- MOTs: FCL only
- in drilldown:
- show column with total TEU value
- show additional columns - one for each type / size combinations with respective counts.
- see mock up below

CBMs count
- MOT: LCL only
- Mapping: CT> ContTab.TableB.Total(in cbm) Commodity#Grand_Total:_cbm for LCL only. SUM(CBM)
Chargeable Weights count
- This counter is for Air specific. This is available only when Air is selected as MOT
- Mapping: CT> ExpTab.17b: Chargeable weight CT#Chargeable_Weight SUM(Chargeable Weight)
Drilldowns and XLS for Counters KPI group B
- Apply this: #Drilldowns v2
How to display KPI value:
- Out of counters above the following KPIs are "non-standard":
- CBM count, Containers count
- only per CT value is available in DB, not per commodity line so display total on first commodity line, the rest are zeros
- CBM count, Containers count
- for all others display per commodity item
- ! make sure total per column is equal total on html for segment that user clicked on
SOW 44 Dates KPI:group B
Mantis:
Spec: #Dates KPI group B
Kostya: SQL
Misha: Drilldowns and Admin
Sasha: Front End
SOW 45 CPU KPI:group B
Mantis:
Spec: #CPU group B
Kostya: SQL and Admin
Misha: Drilldowns
Sasha: Front End
SOW 42 Implement Overlap KPIs
Mantis:
Spec: TBD
Kostya: SQL and Admin
Misha: Drilldowns
Sasha: Front End
SOW 18 LO and EU classes
Mantis:
Spec: #LO and EU KPI classes
Kostya: SQL and Admin
Misha: Drilldowns
Sasha: Front End
SOW 46 Dates KPI group C
combined with SOW 44
SOW 47 CPU group C
combined with SOW 45
SOW 48 File Closing Metrics
Mantis: 4043
Add 2 KPIS:
SOW 49 Notifications for Traffic light
mant: 4012
spec: see new section that has been added - #Notifications for Traffic light
SOW 50 Enable KPIs for internal users
mant: 4009
spec: draft completed - see below
- Add link to KPI Homepage: CT2 Internal > Main Menu > Reports > KPI
- Internal users:
- should see KPIs with E0 multiselect; default - all companies
- should see what each client user would see (users client user list multiselect)
- (moved from SOW 51) tag each individual(!) KPI as internal vs external (hardcode)
- present in admin only external KPIs as an option to Client role users
SOW 51 KPI Admin v2
mant: 4051
spec: below
This is a version 2 of a logic that we did not get completely right first time due to the bugs, spec bugs, change requests.
Link to the spec for previous version of Admin: #KPI Admin.
- 0/ (on hold!) All parameters will be managed for individual KPIs and not classes as programmed now. See mockups below
- 0.1/ Top level will look like this:

- 0.2/ If user selects Cost per Lb and clicks edit he will see pop up where he can edit indiv KPI settings:

- Design above is on hold pending Multi Editor Proposal
- 1/ (on hold!) Add CT2 Internal MAIN MENU > Admin > KPI Global Admin section to manage system wide KPI module related settings
- 2a/ Make #KPI Earliest Date (now set to 01-Jan-2011) to be system wide:
- 2.1a manage through servers config file
- 2.2a display current value as read only in above mentioned Admin section
- 2.3a remove this date as a view only date from individual KPI panel
- Design above is on hold pending Multi Editor Proposal !!!
- 2b/ (moved to SOW 50) tag each individual(!) KPI as internal vs external (hardcode)
- 3/ (on hold!) Add new parameter to individual KPIs: enable/disable client company filter (when visibility is linked to the client group)
- [give 3 options: all together; All and list of individual E0 in the group; individual its only]
- this is on hold - do not implement now !!!
- 4/ (on hold!) Add KPI section to Internal MAIN MENU > Admin > Client Companies
- to manage KPI parameters
- in this section we should:
- enable / disable individual (!) KPis for Client users linked to given company through default E0 visibility
- manage all parameters for this company
- settings above will propagate into user profile on internal where they could be tuned further for specific user
- changes in parent Client Comp record should propagate into user profile on internal
- Design above is on hold pending Multi Editor Proposal !!!
- 5/ None of the settings needs to be available for change in users profile (by user) on Client. See mock up below:

- 6/ Gage parameters changes:
- 6.0/ Should be only managed through "Settings" panel right on the KPI page as well. (!) Remove These settings from Indiv KPI Admin.
- 6.1/ Remove "From created on date" from this panel.
- 6.2/ See mock up below:

KPI Admin v2 Double click functionality
- 7/ Double click functionality to edit should be available as well.
- Currently it works when click on the list and on "edit" button. This functionality works well but would be great to allow double click feature to save time. As to do one by one by Edit button is time-consuming.
SOW 53 Association and Exclusion logic v2
mant: 4072
spec: below
This is a version 2 of a logic that we did not get completely right first time due to the bugs, spec bugs, change requests.
Please apply to all existing and all future KPIs.
Association between week and shipment
For every KPI we need to decide what criteria to use to associate shipment with a particular week.
Same criteria for all classes of KPIs now:
Actual arrival date (air/ocean)
or
Actual Delivery Date (all truck modes)
See also #SOW 57 Association logic for TMS shipments
Exclusion logic
Exclusion for Arrived and Delivered
see association logic
Exclusion if shipment is deleted or alike
Exclude CTs that are:
- canceled or
- deleted or
- rejected (from ASN)
NOTE: do not exclude transmited to 3PL.
Exclusion if parameter in KPI formula is undefined
Examples:
- If KPI is a time frame then exclude shipments that have only one out of two dates/times that define the interval present in the system.
- In CPUs if cost is undefined or unit is undefined
Exclusion if need to divide by zero
SOW 55
Bugs and Changes from UAT of March 7 and 8
NOTE: Marc/Alex tested with E0=Elizabeth Arden on dev4.
Format: Issue# Summary // dev bug OR spec bug OR change // <status>.
- 1 For some reason xls says "TimeFrame: 2013 YTD Average" (instead of weekly timeframe) for Left panel drilldowns for one week // dev bug // dev, qa - done
- 2 Add "Cost per Lb" as an output column option (for download to xls) // change // dev, qa - done
- 3 Left panel weekly number is different from same number on drill down xls // dev bug // dev, qa - done
- (example: Pick Up to Delivered)
- example: total spend ocean
- 4 Shipment Group column contain strange info: decimals instead of integer // dev bug // dev - done, qa - pending
- 5 Each drill down xls should contain KPI itself as an output (as a column and as a total) // change request // dev - done, qa - pending
- example: KPI name: Created to Delivered
- 6 Cost per Kg KPI calculating incorrectly on xls (per CT) // dev bug // dev, qa - done
- 7 Remove KPI title from HTML // change request // dev, qa - done
- 8 Mapping of Ship to Location needs to be changed for AIR / OCEAN (air / ocean – Consignee SHOULD BE CONSIGNEE and/or Import Tab “delivery location” … not the “export pick up deliver to address”…
- see also "0004014: [ASN 20] change mapping for "Ship To Location" in Air/Ocean records" // change // postponed till next Sprint
- 9 do not show CTs that have only one date out of two in the interval // spec bug // dev- done, in qa
- 10 = 5 (duplicate) always show KPI itself as a column on download to xls
- 11 Default value for “downloads” should always be: // change // dev,qa - done
- CT #
- Shipper
- PO
- SKU
- QTY
- 12 Include DUTY/VAT or Exclude DUTY/VAT option is not visible on screen (SPEC IS MISSING? LOW PRIORITY?) // postponed till next release
- 13 The labels for the “bottom right” pannel should be vertical // change // dev, qa - done
- 14 cost per pallet // dev in progress
- calculations are incorrect on xls // dev bug
- exclude CTs with plt=0 values // spec bug? or change request?
- 15 output columns selection to be replaced with drag and drop version // change // planned for next sprint
- 16 we found reports that include canceled or deleted CTs // spec bug // not done
SOW 56 Carrier defined
For Bottom Right Panel please use the following logic.
- For Air associate with Airline
- For Ocean associate with Steamshipline
- For all All Truck modes associate with only Pick Up trucker only for now
SOW 57 Association logic for TMS shipments
In case of TMS associate CTs and timeframes (Weeks/month/quaters/years) based on this date:
- Actual Delivery Date
This will ensure that all CTs associated with a load will be part of same timeframe. (per Marc/Stacy)
SOW 59 Round total spend and CPU values to 2 values after dot
mantis: 4061
In KPI module as in any all values that are financial related and counted in money units should have max 2 numbers after dot.
Apply to all places. List below might not be exhaustive:
- Left Panel: itself, drilldown HTML popup, xls
- Top Right Panel
- Bottom Right Panel: itself, drilldown HTML popup, xls
- KPI panel
SOW 60 Split MOT Ocean options into FCL and LCL
Mantis: 0004066
spec:
In KPI main menu we have one option for all Ocean shipments.
Marc changed his mind and would like to have two options instead now:
- Ocean FCL (map fromFCL(AW) and FCL(MLB) internal options)
- Ocean LCL (map from LCL and Client Consol internal options)
So we need to associate shipments with those two separately.
SOW 61 Changes to main menu values on one tab/KPI class should propagate to other tabs
mantis: 0004060
spec: below
Changes to some Main Menu values on one tab/KPI class should propagate to other tabs. Relevant to these two parameters:
- Client Company
- MOT
For example if you are on "Counters" tab and change MOT to Air then if you click on Lead Times tab you should see MOT changed to Air.
Comment from developer: not as easy as we might think on a development side. But not too bad either.
SOW 62 TMS charges should populate Est tab
mant: 4062
moved to Estimation#SOW_2_TMS_charges_should_populate_Est_tab_automatically
SOW 63 Inclusion logic in case of transmit to 3PLs
mant: 4089
spec: draft below
Core requirement:
- we want these CTs to be avail in KPIs only for some group of users
Solution:
- always use separate E0 for Transmit to option
- associate user with client group
- add this E0 to the group to make Transmit to CTs available in KPI reports under this E0
Questions:
- I assume no programming required for this
SOW 65 Validation for Actual Delivery Date
mant: 4118
spec:
Create additional validation for Actual Delivery date:
System can not set / save Actual Delivery Date
without Estimated Delivery Date being defined
Mapping:
For all MOTs.
Special Case:
If this is empty when Actual Delivery Date is updated from external source such as TMS etc then update both with Actual.
Added:
Automatically fill est date when enter actual date.
IF estimated date is EMPTY = copy actual date
IF estimated date is already filled in = do nothing J
SOW 66 Change logic for KPI Earliest Date
mant: 4102
spec:
Base KPI Earliest Date on the same date logic that we use for association btw CT and week:
Actual arrival date (air/ocean)
or
Actual Delivery Date (all truck modes)
NOTE: Old logic is here #KPI Earliest Date
SOW 67 Replace Created On with Notification Date for all Dates KPI
mant: 4096
spec:
1/ Business reason:
In some cases operators create CT after it was departed or delivered. This creates problem on reporting side with such dates KPIs as:
- created to approved
- created to delivered
2/ If we use notification date instead of created on date we can fix this by editing the date on internal.
3/ Apply this change to 2 existing dates KPI:
- created to approved
- created to delivered
4/ Note that they will of course be renamed into:
- notified to approved
- notified to delivered
END OF WIKI
Cost related SOWs
SOW 52 Cost v2
mant: 4071
spec: below
- New formula is the following:
- if CT is closed then show Actual Cost else show Estimated Cost
- Actual Cost = Sum of All Sales invoices minus Credit Notes
- Estimated Cost = Total of Sell Charges table in Estimation module.
- if CT is closed then show Actual Cost else show Estimated Cost
- (new!) Show only charges linked to E0 through Client Company to Bill To link. See SOW 68 below.
SOW 68 Client Company to Bill To link
mant: 4078
spec:
Core Need
To identify what charges belong to specific Client Company.
Will be used in CPU/Total Cost KPIs, etc.
See KPI#SOW 52 Cost v2 wiki.
Associate Client Company with Bill To List
Add list of Bill To Parties as an attribute to Client Company entity.
Mock Up

SOW 58 Add Duty and VAT switch
mantis: 4074
spec:
1/ We need to provide option to exclude all VAT/duty related charges that we apply:
- through charge codes
- VAT = charge code 1204
- Customs Duties = charge code 1201
- through applying office related VAT:
- on each sales invoice/credit note: Grand Total minus VAT Amount
2/ This should be applied to all cost related KPIs. Currently:
- Total Spend KPI from counters KPI Class
- CPU
3/ UI:
- drop down with options: "Exclude VAT/Duty (default); Include VAT/Duty"
- make it a part of KPIs Main Menu
- pls note that Main Menu will be re-designed soon under 0004126: Main Menu v2
4/ user selection should be stored for next time when KPI will be opened
5/ UI mock up - see below:

6/ (added) In case of TMS must work the same way
SOW 64 Inclusion logic based on CC number
mant: 4090
spec:
0/ Business reason: CTs should not be included into KPI if it does not contain certain "core" charges. In some cases Jaguar plays "minor" role.
1/ If at least one cc from the cc list defined for particular MOT is present in TOC as defined in Inclusion CC Table (see example below) then include this CT from KPI report.
2/ Inclusion CC Table example:
MOT               cc#
----------------------------
AIR               1101
OCEAN             1301, 1401
TRUCK             1501, 1503
3/ Table above is Client Company specific
4/ Must be managed through Client Company Admin
5/ Suggested UI:
5.1/ Add "KPI" tab to Client Companies UI. Add Elimination CC Table to this tab.
5.2/ For every MOT allow admin user to select a list of charge codes
6/ This is for CPU class only
SOW 69 Validation for Origin and Destination country
mant: 4120
spec:
At the moment Actual Departure is set and ready to be saved system should require that Origin and Destination country fields are set.
MOTs/mapping:
- ocean LCL/Client Consol: 11c. ATD:
- air: 1c. ATD - Actual Time of Dept:
- ocean FCL: 11c. ATD:
Added:
In case of grouped CTs system should validate for all CTs
Ask user to ENTER origin/dest countries and process GROUP SAVE (copy this value to all records).
New group operation validation
added later!
Can not remove or add CTs to the group after act dep date is set.
Case when creating a group from one CT with Dep date and another without
In this case require user to enter Dep date and Orig/Dest country if missing.
if we set act dep date in one groupped CT then we have to force to set in all
In case of grouped CTs system should validate for all CTs.
SOW 70 KPI Menu v2
mant: 4126
spec:
Tweak layout:
- narrow the left panel by about 25%
Remove:
- remove "CT Home, Watch List, ..." menu
- remove Main View dropdown
Introduce:
- Top level controls (selection applies to all KPIs)
- Client Company
- MOT
- #Lane single select for From and single for To (follow this link)
- Time period (weekly, monthly, ...)
- KPI class level controls
- select KPI class
- KPI specific level controls
- KPI name
- KPI specific parameters (Ex: Duty/VAT control)
- Settings button
- "Number/Trend/%/Gage"
Menu v2 Mock up
Screen 1:
- Note that to select "To" or "From" user would click on value (Canada for example) and pop up would appear - see below.
- Default for From and To is "Any"

Screen 2 (Pop-up):
- Drop downs at the top allows user to choose between Country and Region. Depending on what is chosen drop downs at the bottom would offer the list of Countries or Regions.

Lane
Lane is defined as a pair {From, To} where From and To could have 3 different types of values:
- Any (indicates that there is no restriction)
- Region
- Country
SOW 71 Drilldowns v3
mant: 4128
spec:
Drilldown is a functionality that gives "GRP/CT/Commodity item level details" for particular segment of visual representation for given KPI.
Defined for:
- selected time frame (week/month/quarter/year) as defined on Left Panel
- same data but restricted to specific Shipper/Consignee/Carrier/Lane(Bottom Right Panel)
Produce pop-up where user can select output fields.
What did not change:
Number of things will change:
HTML view
No need to show html view first
drilldowns header
- A the top print title in large bold that consists of: <KPI class name> + " KPI"
- example:
Cost per Unit KPI
- below - list KPI name and number of shipments
- example:
KPI name: Cost per Kg
Num of shipments: 12
- below - all additional conditions as defined by filters
- example
Client Company: EA
Mode of Transport: Air
Timeframe: 01-30 Jan 2013
Shipper: Elmar
- below - additional info
- example
Currency: USD
filenaming
KPI Type + Week #, Year + (if appropriate: Company Name (first word in name only))
Example:
Shipment Count wk 13 2013 CEI.xls
fields list v3
Below fields defined as:
- <label as it appears on pop-up and xls> // <meaning and/or mapping>
Load attributes:
- Load# //
- Load Kg //
- Load Lb //
- Load cost // Est or Actual Sales Charges (not anymore from XML!)
- Load cost per Lb //
- Load cost per Kg //
- Origin/Destination City/State/Country/Region
- Carrier(s)
Shpt attributes:
- Shpt#
- MOT
- Shpt Kg //
- Shpt Lb //
- Shpt cost // Est or Actual Sales Charges (not anymore from XML!)
- Shpt cost per Lb //
- Shpt cost per Kg //
- Origin/Destination City/State/Country/Region
- Carrier(s)
CT attributes:
- CT#
- MOT
- Shipper // Company name, do we need this field?
- Approved by Planner // name, ASN only
- Approved by Super Planner // name, ASN only
- P.O. Issued by // ASN only
- Created On // date
- Authorized // date
- Act. Pick Up // date
- Act. Delivery // date
- Est. Pick Up // date
- Est. Delivery // date
- Origin/Destination City/State/Country/Region
- Carrier(s)
- Commodity Description // commodity attribute
- Haz // commodity attribute
- CT Lb // commodity attribute
- CT Kg // commodity attribute
- Stack // commodity attribute
SKU attributes:
- SKU
- PO
- Qty
- Description
- Plts
- Pkg on plts
- Loose
- Gross Kg
- Gross Lb
- Piece price // ASN only
- Haz // ASN only
- Stack // ASN only
KPIs:
- list of KPIs enabled for particular users in User Admin
field selector v3
UI idea:
Expandable (tree like) structure:

unit for weight control
- see mock up above
- options: Kg, Lb
- this selector will identify unit of measurement for weight. This will be used for all weight related fields. For example if Kg is set then "CT Kg" field option will not show up.
KPI value label
Now it generically says "KPI value".
We should name it after actual KPI.
xls datatype
- currency should be of type currency
- numerical should be of type numerical with no decimals (digits after dot)
xls format v3
- see mock up below
- xls will have groups of columns:
- Load or GRP
- CT
- SKU
- if at least one field from particular section above is defined (GRP/Load or CT or SKU) then this section is defined and its id should be autoselected by system (GRP#/Load# or CT# or SKU#)
- total values are defined on top line with "-" below (see for example Load Lb column)
- if user chooses one field from GRP level and one from item level (skipping CT#) then system should select CT# field automatically
note on cost associated with SKU line item
Cost should be distributed across line items
drilldown v3 xls examples

X - GRP fields
Y - GRP KPI
Z - CT fields
W - CT KPI
V - SQU fields
Q - Dates KPI
SOW 72 Import old Load records
mant: 4125
spec:
We need these data for period since we have started get loads from TMS till July of 2011. This is due to the fact that originally we did not have a code in place to copy all info into CT2 DB.
Descartes is to provide this data as an xls.
SOW 73 Validation to ensure that containers are assigned
mant: 4143
spec:
Actual Departure Date can not be assigned if there are unassigned containers.
MOTs: Ocean FCL (both sub-modes) and Truck Ocean.
SOW 74 CPU group C
mant:
spec:
See #CPU group C
SOW 75 Needle Movers feature
mant: 4152
spec:
SOW 76 Change colors for Gages
mant: 0004155
spec:
Low Med High now is expressed as Green - Yellow - Red.
Change to: Light Yellow - Green - Light Red. (to be confirmed)
SOW 77 Layout and Graphics changes
mant: 4157
spec:
- make buttons more rounded
- make buttons colored (blue as in "weekly")
- move Settings to Main Menu bar
SOW 78 Change layout for No data to display case
mant: 4158
spec:
Change layout for No data to display case: replace all panels by a blank page and print "No data to display" in the center.

