KPI
From UG
(→KPI Panel) |
(→Main View) |
||
| Line 258: | Line 258: | ||
* gage indicator | * gage indicator | ||
| - | Right column: KPI value | + | Right column: |
| + | * KPI value | ||
'''Top right panel''' | '''Top right panel''' | ||
Revision as of 20:23, 4 June 2012
Info
Mantis:
- parent: 0003545
- category: DR/KPI:ph1
Team:
- Sponsor: Simon
- UAT/Prod Manager: Marc
- Lead SA/PM/SIT: Alex
- Lead Dev1: Sasha
- Dev2: Kostya
- Graphics: Vic
- QA: Roma
Email groups:
alex@jaguarfreight.com; a.pivniak@elcosol.com; k.ushakov@elcosol.com; v.makhankov@elcosol.com; r.lakhno@elcosol.com;
Requirements
- This Phase One should include first portion of DRs/KPIs delivered
- Must be production quality
- This phase is for Arden primarily (all MOTs) but also for Sales Dept to show possibilities to prospects and existing Clients
- This project is very important top visibility project
- Also right tool/lib should be evaluated/selected for the future (example: LogiXML vs ZK API/other Java APIs)
- Due dates:
- production - end of June
- vendor/libs evaluation - end of May
Solution
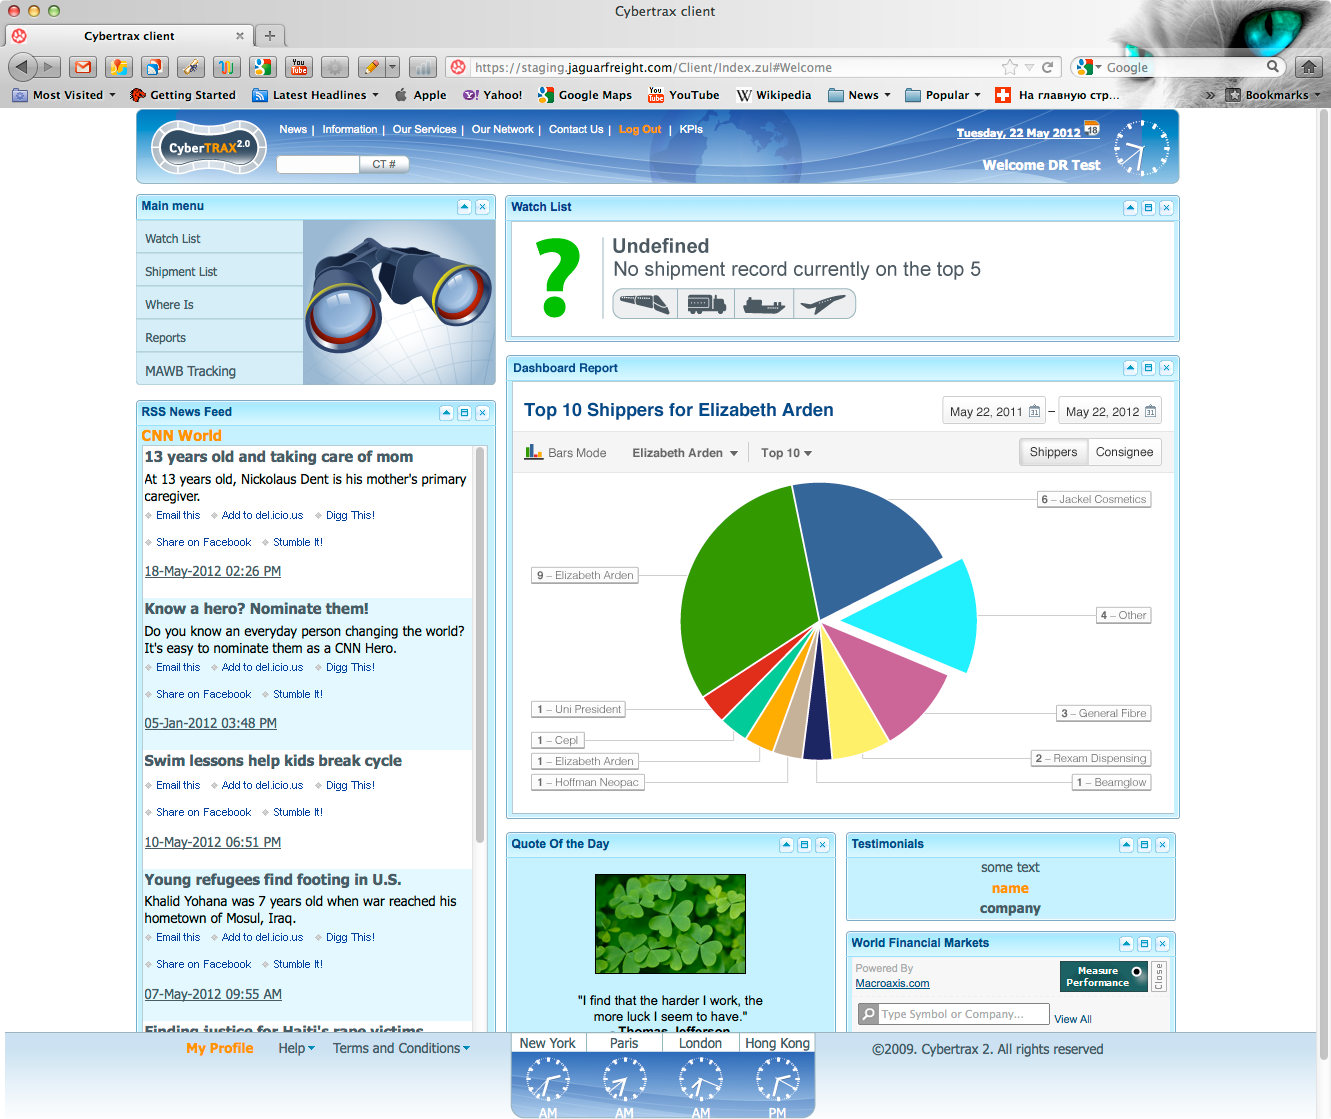
DR1 Simple Shipment count DR
- See mock-up below
- Title: Top Shippers / Consignees
- Location: this DR should appear on homepage
- Axis X: display Shippers or Consignees plus "Others"
- display largest to smallest (left to right)
- Axis Y: shipment count
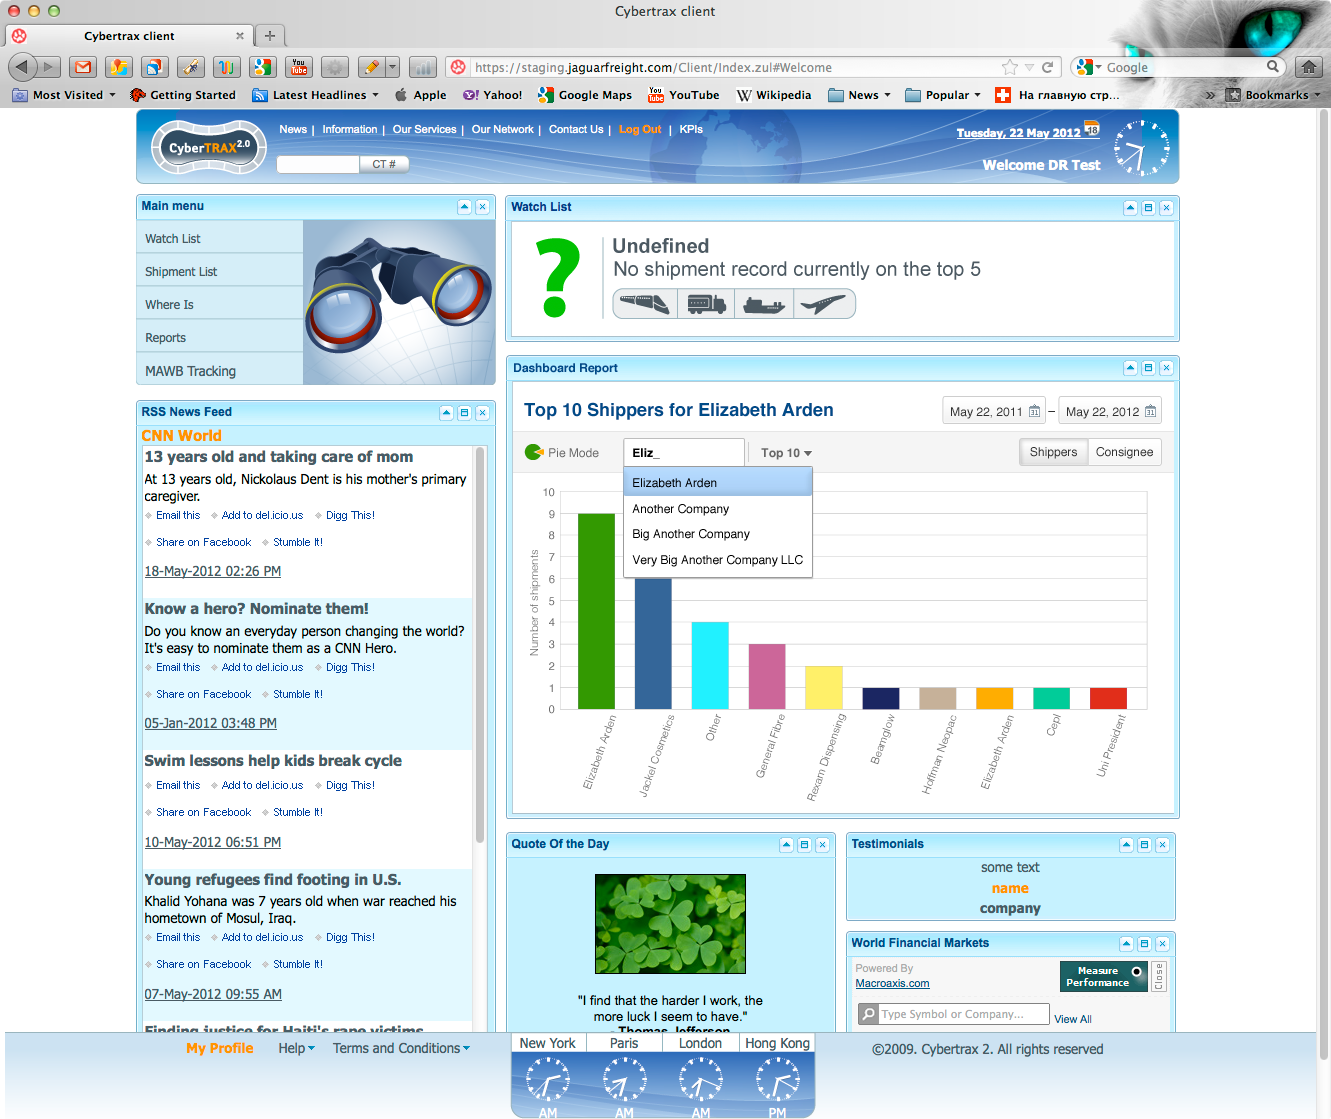
- Bars vs Charts - two displays to be supported, need selector to switch between two
- Client Company filter:
- single select
- if on internal then show all E0;
- if on Client show list of E0s after visibility rules are applied
- Year: timeframe filter. Use CT Created On date to associate CT with the year
- Shippers vs Consignees selector: group by indicator
- Top X selector:
- controls in how many groups to separate shipments
- one additional group is always "Others"
- default value is to be managed through User Admin on internal
- max choice= 10
DR1 Graphics and UI mock up
!!!! Status Note: below version is not final and has some errors !!!
Pie chart example:
Bar chart example:
DR2 Complex Shipment Data per Client per Year DR, PART A
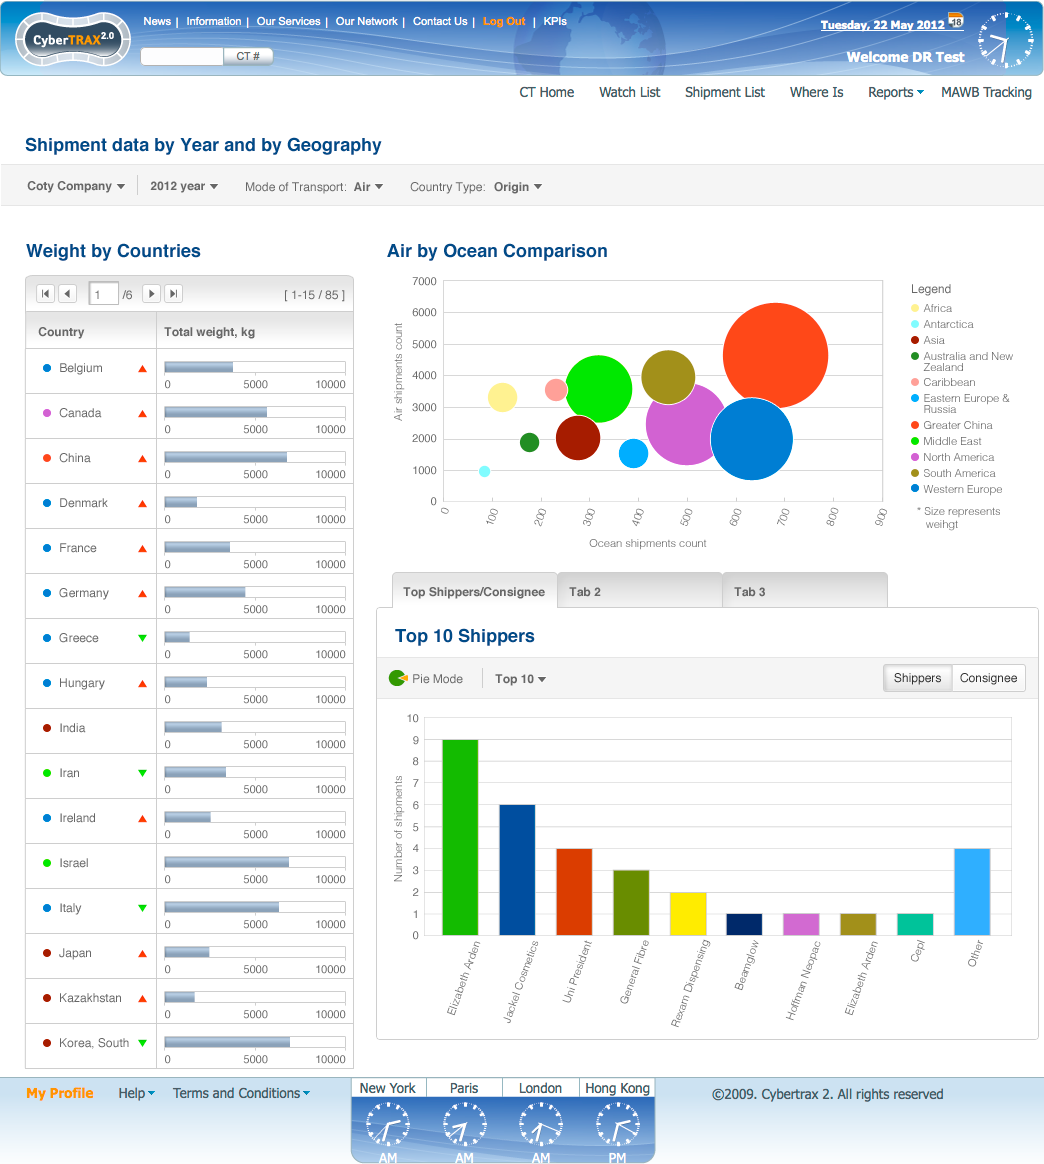
DR2 Mock Up
!!!! Status Note: below version is not final and has some errors !!!
Original outdated version see here: File:DR2.JPG
DR2 General Info
This DR consists of:
- Title : "Shipment data by Year and by Geography"
- #DR2 Main menu (at the top)
- #DR2 Left panel
- #DR2 Top Right panel
- #DR2 Bottom Right panel
DR2 Main menu
- Client Company:
- single select
- if on internal then show all E0;
- if on Client show list of E0s after visibility rules are applied
- Year': timeframe, use CT Created On date to associate CT with the year
- Country type: options - see below
- Origin - (use country in Shipper)
- Destination - (use country in Consignee)
DR2 Left panel
- two column table sorted by country alphabetically
- left column: countries that correspond to origin/dest countries - selection in the main menu
- right column: corresponding total weight of all CTs for particular country
- max (now shows 10,000 on mock up) - design option: use appropriate scale based on max value for data available
- red/green arrow
- this indicates change from previous year (red - up; green - down)
- if data for previous year is unavailable then no arrow
- country region indicators
- color of the dot indicates what region they belong to
- paging
DR2 Top Right panel
DR2 Air by Ocean comparison table
- Title: Air by Ocean comparison table
- Axis X: ocean shipments count
- Axis Y: air shipments count
- Plotted data:
- each dot corresponds to one Region
- color of the dot indicates what Region is it as defined on Legend
- size of the dot is proportional to the total weight of the CTs for given Region
- Regions - as defined in CT2 DB - see below:
- if easy to implement show only regions that have data
- Legend: indicates unique color per Region
Africa s
Antarctica s
Asia m
Australia and New Zealand s
Caribbean s
Eastern Europe & Russia s
Greater China b
Middle East b
North America b
South America m
Western Europe b
this is note for Vic: in your mock-up example use this typical distribution: b - big, m - medium, s - small
DR2 Bottom Right panel
This is a multi tab panel. Some tabs are defined under Part B (another section).
DR2 Tab1 Top Shippers, Consignees
Re-use #DR1 Simple Shipment count DR
Please note that in this case we do not need these filters displayed on the panel (since thes values are selected in Main Menu):
- time frame
- E0 Client Company
Also in this case more filters would be applied (see main menu):
- MOT
- country type
DR2 Misc
- DR2 should appear as Tab (on "KPI Dashboard" page - see "KPIs" link in top menu on Client App):
- Tab title: "Data by Year/Geography"
- DR2 should be available as option in User Admin on internal App (on/off).
DR2 Complex Shipment Data per Client per Year DR, PART B
DR2 Tab2
This was put on hold
DR2 Tab3
This was put on hold
DR3 Cost, Weight, Count. Group by Week, Shipper, Consignee, Carrier, Lane
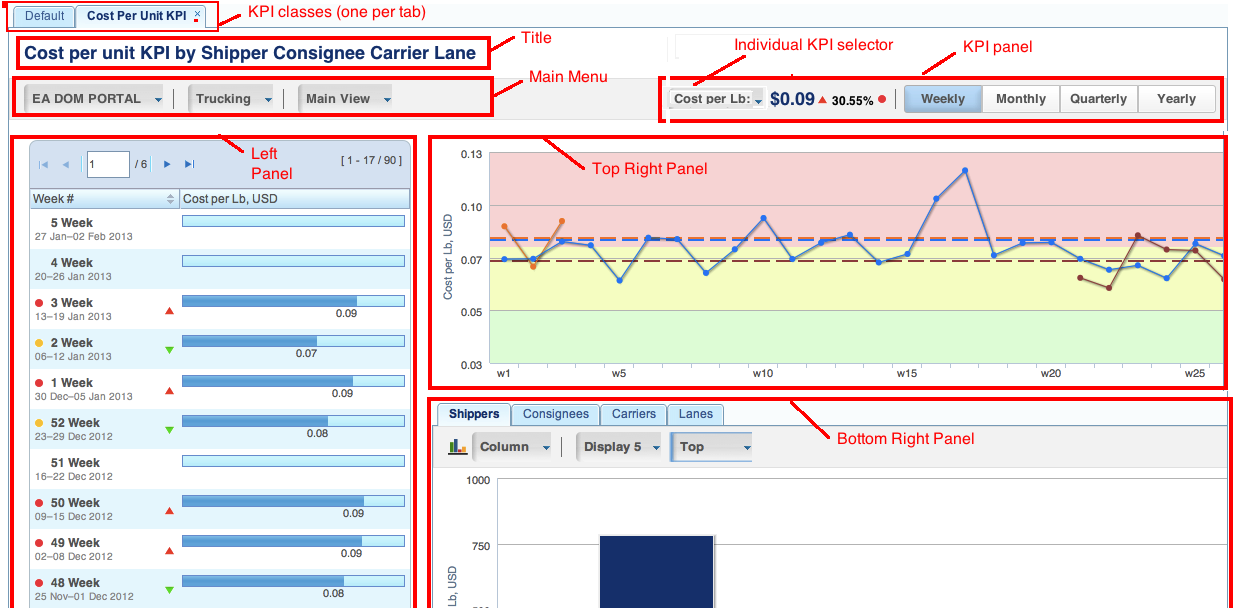
DR3 Layout
It consists of the following sections:
- title
- main menu
- KPI panel
- left panel
- top right panel
- bottom right panel
See also Figure below:
Title and Main Menu
Title: Shipment data: Cost, Weight, Count.
Main Menu:
- Client Company - single select, list restricted by user visibility
- MOT - single select, options: Air, ...
- View type - controls what is displayed inside panels. Options:
- Main View
- Shippers View
- Consignees View
- Carriers View
- Lanes View
KPI Panel
- label: cost per kg (KPI type and unit of measurement)
- currency: USD
- number: actual value of KPI
- arrow: change indicator comparatively to previous period defined by "timeframe" (up red, down green)
- percentage: change in % comparatively to previous period defined by "timeframe"
- timeframe:
- gage: indicates tolerance level, see #Tolerance levels parameters
Tolerance levels parameters
- this is a list of parameters managed by user in user profile
- controls what is considered green vs yellow vs red zone for KPI
Left panel, Top right panel, Bottom right panel
Content on these panels is controlled by "View Type" selector. See details below.
Main View
Left panel
Left column:
- this year weeks to date (w1, w2, .... )
- arrow indicator
- gage indicator
Right column:
- KPI value
Top right panel
Axis X: this year weeks to date (w1, w2, .... )
Axis Y:
- plot A: KPI this year
- plot B: KPI last year
Bottom right panel Tab 1
- Type: bar/pie
- Axis X: top 20 for Shippers
- Axis Y: KPI
Bottom right panel Tab 2
- Type: bar/pie
- Axis X: top 20 for Consignees
- Axis Y: KPI
Bottom right panel Tab 3
- Type: bar/pie
- Axis X: top 20 for Carriers
- Axis Y: KPI
Bottom right panel Tab 4
- Type: bar/pie
- Axis X: top 20 for Lanes
- Axis Y: KPI
Shippers View
Left panel
Left column:
Right column:
Top right panel
Bottom right panel Tab 1
Bottom right panel Tab 2
Bottom right panel Tab 3
Bottom right panel Tab 4
Consignees View
Carriers View
Lanes View
Shippers View
Consignees View
Carriers View
Lanes View
Work breakdown structure and Change Requests
Sequence
- first 3567, 3575 in parallel
- next 0003583
- next 0003595
3567 DR1 Simple Shipment count DR
- Sasha: Java/SQL
Spec: #DR1 Simple Shipment count DR
3575 Evaluate LogiXML
- Kostya, Vlad
0003583 DR2 Complex Shipment Data per Client per Year DR, PART A
- kostya: SQL, Java b-end
- sasha: b-end, f-end
spec: #DR2 Complex Shipment Data per Client per Year DR, PART A
0003595 Complex Shipment Data per Client per Year DR, PART B
spec: #DR2 Complex Shipment Data per Client per Year DR, PART B
Timeline Milestones Deadlines
- May 20:
- project STARTED
- May 28, Mon, 9am EST:
- 3567 DR1 : dev/QA completed and moved to SIT
- May 29, Tue, 11 am EST:
- 3567 DR1 : SIT completed and moved to UAT (demo to Marc)
- 3575 Evaluate LogiXML: Report with time estimates presented to Marc
- June 1, Fri, 9am EST:
- 0003583 DR2 part A: dev/QA completed and moved to SIT
- TBD
- TBD
- June 30, Sat
- project END
Architecture and Technical Design and Code Review
Code
Project repo root: https://dev-kuchma.jaguarfreight.com/repos/cybertrax/branches/DR_KPI/java/CyberTrax/
Revision 4816 // --Alex 14:41, 30 May 2012 (EDT)
ZULs
/client/kpi/
..
kpiChartWindow.zul   - zul for Cost Per Pound see File:Cost per pound for a year.png
kpiWindow.zul   - ???
loadListWindow.zul   -  ???
panelCostAndValue.zul  - File:Cost per pound Lev1.png
xlsFieldSelection.zul  -  File:Output options.png
/client/components/kpi/
..
KpiChart.zul  -  ???
/client/dashboards
..
DashboardPanel.zul
DashboardReportsWindow.zul
DashboardShipmentData.zul


