DR KPI Phase One QA SIT UAT
From UG
(Difference between revisions)
(→QA Report June 13) |
(→QA Reports) |
||
| (4 intermediate revisions not shown) | |||
| Line 10: | Line 10: | ||
=== QA Report June 13 === | === QA Report June 13 === | ||
| - | Title: | + | '''Title''': |
| - | + | ||
| - | Main menu: | + | * wrong style |
| - | + | ||
| + | '''Main menu:''' | ||
| + | |||
| + | * Wrong style, fonts | ||
| + | * Change: Remove label "Transport Mode" | ||
| + | |||
| + | '''KPI Panel:''' | ||
| + | |||
| + | * wrong style | ||
| + | * missing gage | ||
| + | * remove year selector (out of scope) | ||
| + | |||
| + | '''Left Panel:''' | ||
| + | |||
| + | * wrong style | ||
| + | * missing change indicators | ||
| + | * use new style for labels - see latest mock up | ||
| + | |||
| + | '''Upper Top Panel:''' | ||
| + | |||
| + | * see latest mock-up | ||
| + | |||
| + | '''Bottom Right Panel:''' | ||
| + | TBD | ||
| + | |||
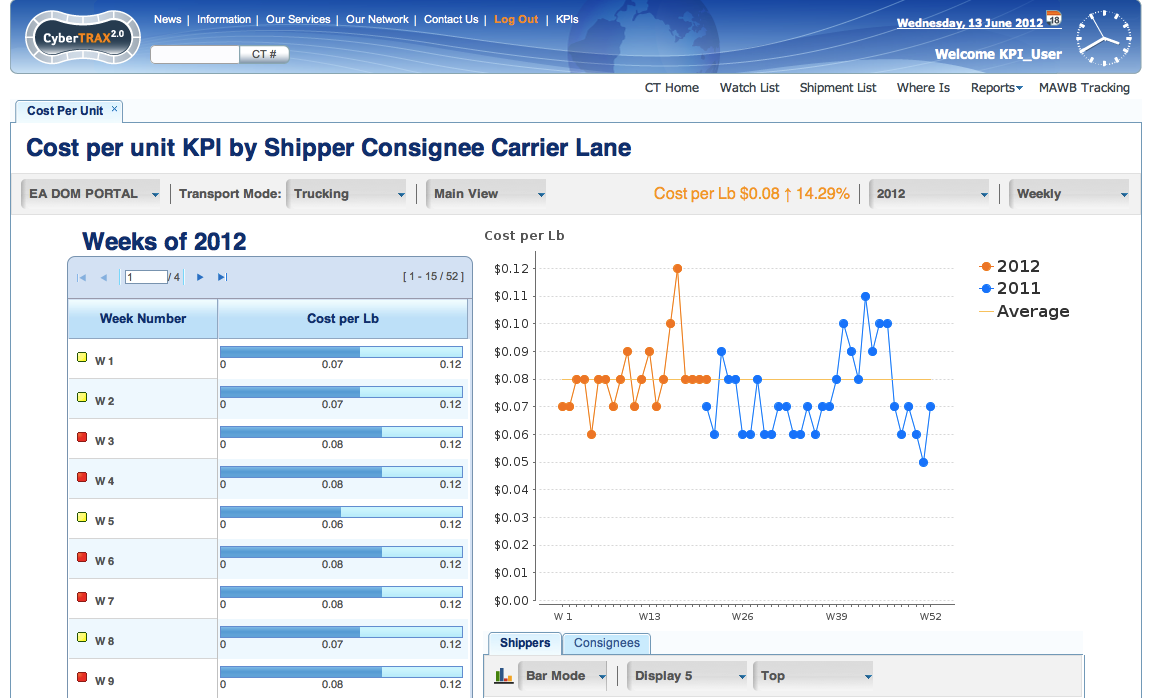
| + | How it is now on dev envir - see below. | ||
Top: | Top: | ||
| Line 23: | Line 47: | ||
[[File:Dr3 qa bottom.png | 900px]] | [[File:Dr3 qa bottom.png | 900px]] | ||
| + | |||
| + | == UAT == | ||
| + | |||
| + | |||
| + | === DR3 phase 1A Milestones and deadlines === | ||
| + | |||
| + | ==== M1 Mon June 11 Demo to Alex ==== | ||
| + | |||
| + | Time: | ||
| + | |||
| + | Deliver: | ||
| + | * demo | ||
| + | * scope: Main View | ||
| + | |||
| + | ==== M1 Script ==== | ||
| + | |||
| + | * ... | ||
| + | * Log in as: '''KPI_User''' | ||
| + | ** login: KPI_User@com.com | ||
| + | ** pass: Admin1234 | ||
| + | * Go to KPI tab -> Cost Per Unit tab | ||
| + | * Check/Enter Company Name = "'''EA DOM PORTAL'''" | ||
| + | * Check/Select Mode of Transport = "'''Trucking'''" | ||
| + | * Check/Select View Mode = "'''Main View'''" | ||
| + | * Check/Select Time frame = "'''2012'''" | ||
| + | * Check/Select Axis X mode to "'''Weekly'''" | ||
| + | * <span style="color:grey">on KPI Panel: Check/Select KPI = "Cost per Pound"</span> | ||
| + | * Left Panel | ||
| + | ** Weeks column | ||
| + | *** check labels | ||
| + | *** check paging, see No Data Found | ||
| + | ** Cost per Lb (KPI) column | ||
| + | *** see Cost per Lb progress bar and values | ||
| + | *** compare to traffic light indicators | ||
| + | * Top Right Panel | ||
| + | ** check axes labels | ||
| + | ** check legend | ||
| + | ** check chart hints | ||
| + | ** change Time Frame value'' - see chart/legend updates'' | ||
| + | ** change Weekly/Monthly value'' - see chart updates'' | ||
| + | * Top Bottom Panel | ||
| + | ** check axes labels | ||
| + | ** check chart hints | ||
| + | ** change chart type - bar/pie | ||
| + | ** combine statistic parameters - top/bottom, 5/10/15/20'' - see chart updates'' | ||
| + | ** click Shippers/Consignees/Carriers/Lanes tabs'' - see chart updates'' | ||
| + | * ... | ||
Current revision as of 18:20, 20 June 2012
Contents |
[edit] About
[edit] QA Plans
[edit] QA Reports
[edit] QA Report June 13
Title:
- wrong style
Main menu:
- Wrong style, fonts
- Change: Remove label "Transport Mode"
KPI Panel:
- wrong style
- missing gage
- remove year selector (out of scope)
Left Panel:
- wrong style
- missing change indicators
- use new style for labels - see latest mock up
Upper Top Panel:
- see latest mock-up
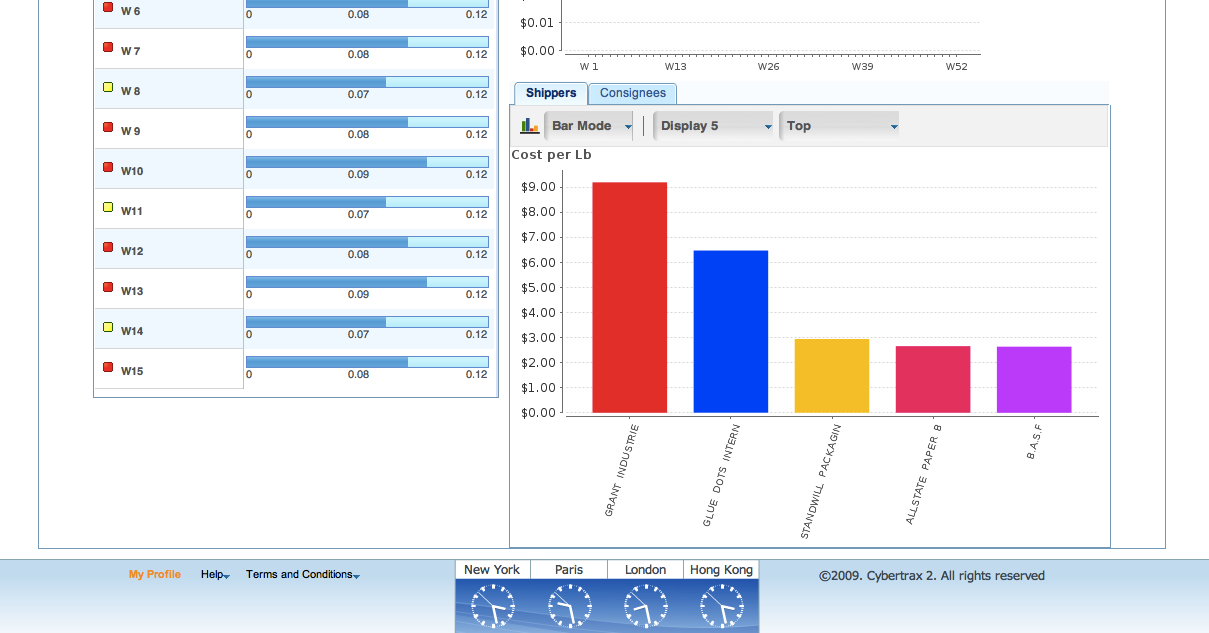
Bottom Right Panel: TBD
How it is now on dev envir - see below.
Top:
Bottom:
[edit] UAT
[edit] DR3 phase 1A Milestones and deadlines
[edit] M1 Mon June 11 Demo to Alex
Time:
Deliver:
- demo
- scope: Main View
[edit] M1 Script
- ...
- Log in as: KPI_User
- login: KPI_User@com.com
- pass: Admin1234
- Go to KPI tab -> Cost Per Unit tab
- Check/Enter Company Name = "EA DOM PORTAL"
- Check/Select Mode of Transport = "Trucking"
- Check/Select View Mode = "Main View"
- Check/Select Time frame = "2012"
- Check/Select Axis X mode to "Weekly"
- on KPI Panel: Check/Select KPI = "Cost per Pound"
- Left Panel
- Weeks column
- check labels
- check paging, see No Data Found
- Cost per Lb (KPI) column
- see Cost per Lb progress bar and values
- compare to traffic light indicators
- Weeks column
- Top Right Panel
- check axes labels
- check legend
- check chart hints
- change Time Frame value - see chart/legend updates
- change Weekly/Monthly value - see chart updates
- Top Bottom Panel
- check axes labels
- check chart hints
- change chart type - bar/pie
- combine statistic parameters - top/bottom, 5/10/15/20 - see chart updates
- click Shippers/Consignees/Carriers/Lanes tabs - see chart updates
- ...


