DR KPI Framework (for non AR reports)
From UG
(→Solution) |
(→Level 2) |
||
| (6 intermediate revisions not shown) | |||
| Line 58: | Line 58: | ||
'''1) in Parameters section''' | '''1) in Parameters section''' | ||
| - | * update list of Axis X dropdown items to - | + | * update list of Axis X dropdown items to - days, weeks, months, quarters, years, carriers, consignees, shippers |
* rename Axis X dropdown to Group By | * rename Axis X dropdown to Group By | ||
* add "Download to Excel" button for results on Level 2 | * add "Download to Excel" button for results on Level 2 | ||
| Line 71: | Line 71: | ||
* display specified number of chart segments for "Group By" parameter | * display specified number of chart segments for "Group By" parameter | ||
** When we select one of Time Period radio button then Chart segments reflect last time range per selected period. | ** When we select one of Time Period radio button then Chart segments reflect last time range per selected period. | ||
| - | ** When we set Time Frame for Chart from Filters Panel the system calculates number of segments automatically in depends from | + | ** When we set Time Frame for Chart from Filters Panel the system calculates number of segments automatically regardless of Time Period (but divides Axis X in depends from Group By). |
'''Example 1 (linear chart, parameter ''Days''):''' | '''Example 1 (linear chart, parameter ''Days''):''' | ||
| Line 170: | Line 170: | ||
''' STEP 2 (Define key parameters)''' | ''' STEP 2 (Define key parameters)''' | ||
| - | * KPI entity is a shipment. | + | * '''KPI entity''' is a shipment. |
| - | * KPI function is difference in days between date of arrival of shipment and date of its creating in CT2. | + | * '''KPI function''' is difference in days between date of arrival of shipment and date of its creating in CT2. |
| - | * KPI measure unit is a day. | + | * '''KPI measure unit''' is a day. |
| - | * Key Date rule. Key events based on following dates: | + | * '''Key Date rule'''. Key events based on following dates: |
:* [http://ct.jaguarfreight.com/wiki/CT_bo#Created_On_Date Created On Date]. | :* [http://ct.jaguarfreight.com/wiki/CT_bo#Created_On_Date Created On Date]. | ||
:* [http://ct.jaguarfreight.com/wiki/CT_bo#Actual_Delivery_Date Actual Delivery Date] ''(a.k.a. GenTab.y. Actual Delivery)'' from [http://mantis.jaguarfreight.com/wiki/CT_bo#General_Fields GenTab] of CT. | :* [http://ct.jaguarfreight.com/wiki/CT_bo#Actual_Delivery_Date Actual Delivery Date] ''(a.k.a. GenTab.y. Actual Delivery)'' from [http://mantis.jaguarfreight.com/wiki/CT_bo#General_Fields GenTab] of CT. | ||
| - | :* | + | :* Rule: report should handle CTs with Delivery Date within Time Frame (see below) and calculate KPI function for them. |
| - | * "Group By" methods. | + | * '''"Group By" methods.''' |
| - | :* Standard methods: all Time (days, weeks, months, quarters, years) | + | :* Standard methods: all Time (days, weeks, months, quarters, years); carriers, consignees, shippers. |
:* Specific methods: planners. | :* Specific methods: planners. | ||
| - | * Filters. | + | * '''Filters'''. |
:* Standard filters: PO contains, SKU contains, Approved Date, Pick Up Date, Routed Date, Delivery Date, Carrier. | :* Standard filters: PO contains, SKU contains, Approved Date, Pick Up Date, Routed Date, Delivery Date, Carrier. | ||
:* Specific filters: Planner. | :* Specific filters: Planner. | ||
| - | * Chart types. | + | * '''Chart types'''. |
:* linear chart for every time grouping. | :* linear chart for every time grouping. | ||
:* bar chart for grouping by carriers, planners etc. | :* bar chart for grouping by carriers, planners etc. | ||
| - | * Output fields. | + | * '''Output fields'''. |
:* CT#. | :* CT#. | ||
:* Load #. | :* Load #. | ||
| + | :* Created to Delivered (KPI column calculated as by formula Actual Delivery Date - Created On Date). | ||
:* Created On Date. | :* Created On Date. | ||
:* Actual Delivery Date. | :* Actual Delivery Date. | ||
| - | * Default settings. | + | :* Shipper. |
| - | :* Time Frame: | + | :* Consignee. |
| - | :* Group | + | :* Carrier. |
| + | :* Pick Up Location. | ||
| + | :* Delivery Location. | ||
| + | :* Planner. | ||
| + | NOTE: need to define and add to list other KPI's which can be overlapped with current (depends from key entity). | ||
| + | * '''Default settings''' (in ''My Profile'' section). | ||
| + | :* ''Time Frame'': to be able select one from previous ''day/week/month/quarter/year''. | ||
| + | :* ''Group By'': to be able select one from list included standard and specific ''"Group By"'' methods. | ||
''' STEP 3 (Implementation parts)''' | ''' STEP 3 (Implementation parts)''' | ||
| - | * Client Visibility Rules | + | * We should use Client Visibility Rules when showing KPI info |
* '''Settings''' | * '''Settings''' | ||
| - | + | ''Default values of KPI parameters should be set up in '''My Profile''' section.'' | |
:* Date KPI panel settings should be added. | :* Date KPI panel settings should be added. | ||
:* We need ability to set up default values for parameters: | :* We need ability to set up default values for parameters: | ||
| Line 207: | Line 215: | ||
* '''Level 1''' | * '''Level 1''' | ||
| - | Initial KPI displaying. | + | '''Initial KPI displaying.''' |
| + | |||
* A table with 4 columns: | * A table with 4 columns: | ||
:* Name of KPI, | :* Name of KPI, | ||
:* Time Frame range, | :* Time Frame range, | ||
| - | :* KPI value (KPI measure in round brackets), | + | :* KPI value (+ KPI measure, ''maybe in round brackets''), |
| - | :* Change. | + | :* Change (KPI changes from past Time Frame). |
:* Headers: Name, Time Frame, KPI, Change. | :* Headers: Name, Time Frame, KPI, Change. | ||
| + | |||
| + | * "Created to Delivered" KPI on Level 1 ''(as well as Change)'' is average value for all shipments delivered per selected Time Frame: | ||
| + | : 1) calculate difference '''Delivered-Created''' for every shipment | ||
| + | : 2) get all days as amount of calculated differences | ||
| + | : 3) divide obtained sum by number of handled shipments | ||
* '''Level 2''' | * '''Level 2''' | ||
| - | Chart displaying. | + | '''Chart displaying.''' |
| + | |||
| + | * First time opened chart should be look in correspondence with default settings: | ||
| + | :* ''"Group By"'' and ''"Time Period"'' sections should be set in values specified in '''''My Profile''''' | ||
| + | :* Chart type should be suitable for ''"Group by"'' value | ||
| + | :* Filter Panel should be minimized and all filters are empty | ||
| + | ::* except Delivery Date filter displayed start (''"from"'') and end (''"to"'') dates of Time Frame range | ||
| + | * Selecting of new ''"Group By"'' or ''"Time Period"'' values refreshes the chart without additional confirm | ||
| + | * Changes on Filters Panel will update the chart after pressing of ''"Generate Result"'' | ||
| + | :* Delivery Date filter after manual update should used instead ''"Time Period"'' for chart displaying | ||
* '''Level 3''' | * '''Level 3''' | ||
| - | Spreadsheet displaying. | + | '''Spreadsheet displaying.''' |
| + | * 1) Click on "Download to Excel" button and get file | ||
| + | * OR | ||
| + | * 2) Activate by clicking on or chart (when it is bar type), define output fields, click on the button | ||
== History == | == History == | ||
=== 0003131: [DR/KPI] DR KPI Framework (for non AR reports) === | === 0003131: [DR/KPI] DR KPI Framework (for non AR reports) === | ||
Current revision as of 00:33, 27 February 2012
Contents |
[edit] Info
- 0003034 (* DR/KPI) ....... <proj>
[edit] Core Need
To produce common approach (if possible) to multiple DRs/KPIs in the system
- See specs for various KPIs in Category: DRs and KPIs such as Arden cost per pound, Cost per unit, etc
- AR DRs (Action Required DRs are outside of this for now). See Category: Action Required DRs
[edit] Requirements
See these wikis:
- Cost per pound KPI (TMS based Arden ) (solution) - first version is in production
- Cost KPIs (cost per unit) (concepts and requirements) - BA completed
- KPIs_for_OpsTruck#Average_times_KPI - BA completed
[edit] SOW 1
[edit] Summary
Solution designed to add more flexibility and new abilities of DR KPI:
- merge all KPI parameters (time periods/carriers) in one "Group By" parameter
- be able select separate grouping parameter
- set the number of segments on Axis X
- download to spreadsheet all results of chart on Level 2 (not only for one clickable bar on Level 3)
[edit] Glossary
- DR KPI Level 1 is a table of averaged KPI value (one or more) per sepecified time frame.
- Time frame for KPI calculating set on KPI settings tab in My Profile section.
- DR KPI Level 2 is a chart of one KPI that reflects averaged value of KPI's amount in relationship to certain parameter.
- Level 2 consists of 3 sections: Parameters, Chart, Filters
- DR KPI Level 3 is a spreadsheet of averaged KPI value (one or more) per sepecified time frame.
[edit] Preliminary works
- fix known bugs to make proper calculations on Level 1, including exception error message for "previous year" period
[edit] Improve Design
[edit] Level 2
NEEDS:
* Change list of parameters displayed on Axis X - Time, Carriers, Consignees, Shippers
* Change "time period" dropdown - remove "Days" / use "Group By" label instead "Axis X"
* Linear chart for Time, bar chart - for others
* Carriers and Truckers should be the same named (now aren't) - ask Mark!!!
* add "Download to Excel" button
Common idea
- We suggest merge a time and other KPI parameters into one list.
- Chart data can be grouped by each parameter.
- Time Frame range can be set on Filters Panel in Delivery Date databoxes or by default on Time Period radio buttons section.
- (by default it is one measure unit range and depends from certain parameter).
We need to make the following updates:
1) in Parameters section
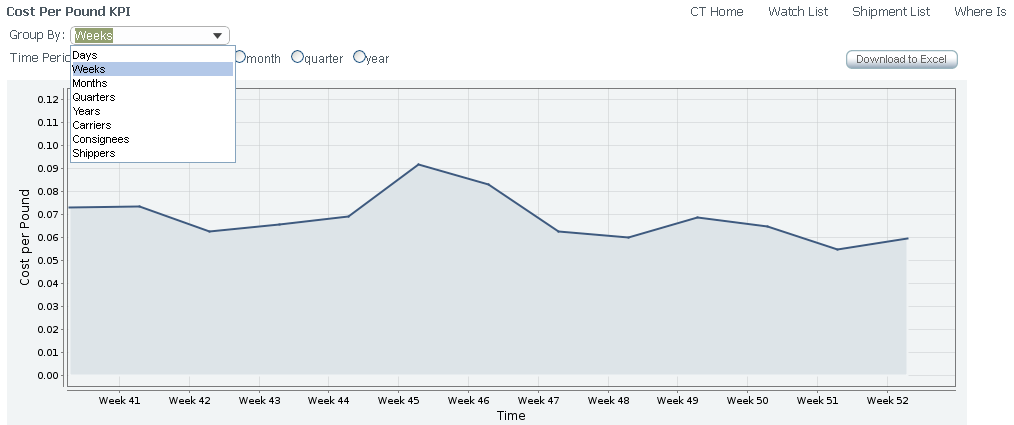
- update list of Axis X dropdown items to - days, weeks, months, quarters, years, carriers, consignees, shippers
- rename Axis X dropdown to Group By
- add "Download to Excel" button for results on Level 2
2) in Chart section
DR KPI on Level 2 is a chart of one KPI (on Axis Y) that reflects averaged value of KPI's amount per sepecified time frame and grouped by certain parameter (on Axis X).
- use following type of charts:
- linear chart for time parameters,
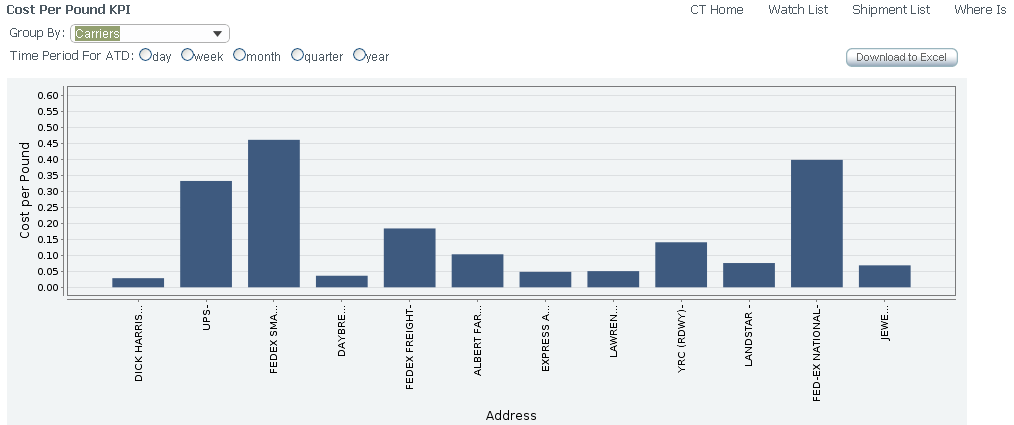
- bar chart for carrier parameters.
- display specified number of chart segments for "Group By" parameter
- When we select one of Time Period radio button then Chart segments reflect last time range per selected period.
- When we set Time Frame for Chart from Filters Panel the system calculates number of segments automatically regardless of Time Period (but divides Axis X in depends from Group By).
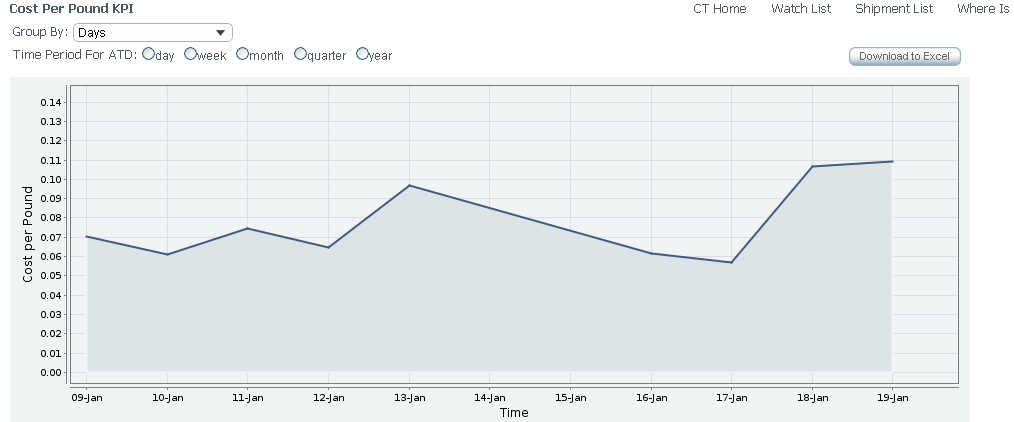
Example 1 (linear chart, parameter Days):
Example 2 (linear chart, parameter Weeks):
Example 3 (bar chart):
3) in Filters section
- add Delivery Date "From" and "To" timeboxes
[edit] Look and feel
- All three parts of KPI frame work on level 2 (Parameter section, Chart section and Filters panel) should fit on one screen
- Labels features:
- when Group By = Quarters, label should be look like Q1-2011 ("Q"+Number of quarter - Four-digit year)
- when Group By = Carriers/Consignees/ Shippers, label should contain only name of carrier/consignee/shipper (without city name)
[edit] Level 3
NEEDS:
* add new KPIs and update list of Output Fields
* KPI overlapping - display several KPIs in adjacent columns
[edit] Look and feel
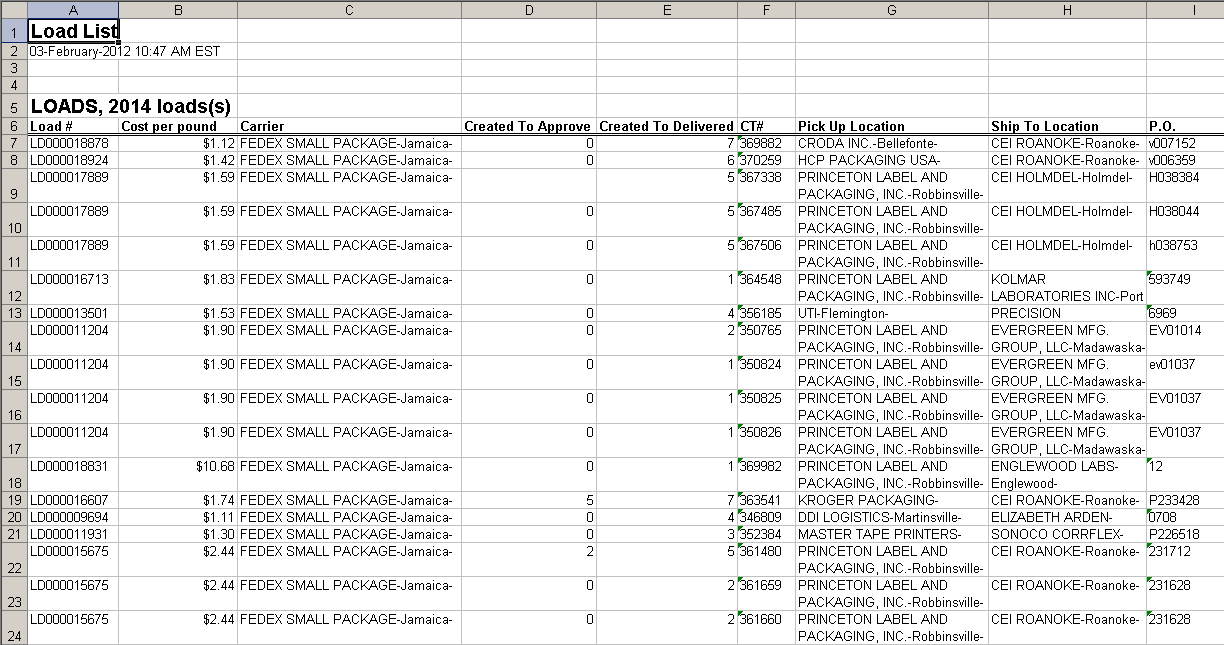
- Cost per pound KPI should be formatted as Currency with two decimals
- Time KPIs (Created To Approve, Created To Delivered) should be formatted as Integer Number
Example:
[edit] KPI settings
- default Time Frame (comply with Time Period from KPI Level 2)
- default Group By based on Time (days, weeks, months, quarters, years)
- TBD
[edit] SOW 2
Mantis: 3474: [DR/KPI] Create DR KPI Framework / External KPIs (SOW 2)
[edit] Core need
Implement 1 ‘date based’ KPI as a proof of concept
[edit] Concept
Common requirements for adding new KPI
To simplify further process of adding new KPI in CyberTrax we suggest use unified procedure of defining KPI.
- STEP 1. MO requests a new KPI and provides information for analysis.
- STEP 2. BA prepares information for development as list of key parameters:
- Key entity. Base of KPI or that for which the KPI is calculated.
- Example: shipment (for CT-based KPI), load (for Load-based KPI), user (for User-based KPI), trucker (for Trucker-based KPI).
- KPI function. Formula to calculate KPI. Result is always a number (integer or real).
- Should be shown on Axis Y in its own measure unit.
- Example: cost per pound/lane, created to approved/rejected/delivered.
- KPI measure unit. Name of units in which the KPI is to be measured.
- Example: USD (Cost and value KPIs), Day (Date KPIs).
- Key Date rule. Points or expression for key events of KPI (created, approved, delivered etc).
- Mostly depends from KPI family (cost, date) or KPI base (key entity).
- Example: Created on Date, Approved Date, Actual/Estimated Delivery Date.
- "Group By" methods. List of categories which can be used for grouping of KPI on Chart.
- Will be shown on Axis X.
- Each KPI has its own set of group by (default + specific).
- Should correspond with the default settings (ideally be the same).
- Example: days, weeks, months etc; carriers, users etc.
- Filters.
- Set of possible rules to select data slice by some value.
- Default set of filters.
- Specific filters for KPI family or one KPI.
- Chart types.
- Example: line, bar, pie. Note: for Group By = Carriers makes no sense to use linear chart.
- XLS output fields.
- Subset of values from KPI base object to output in spreadsheet (define default columns), their order of sequence, mapping and formatting.
- Example: days, weeks, months etc; carriers, users etc.
- Default settings.
- Time Frame. Range of dates per which is calculated KPI value for Level 1. Also it used for visualization of KPI at first time opening of Level 2.
- Group By. It defines method the grouping of subset of values of selected KPI per Time Frame on Chart (Level 2).
- NOTE: Defaults should contain only appropriate values for certain KPI.
- STEP 3. Developer implements solution that suggested the BA with using prepared key information.
[edit] Solution
We select "Created To Delivered" KPI for using as example.
STEP 1 (Define KPI)
Core of ‘date based’ "Created To Delivered" KPI is number of days since the date of creation the shipment until the date of its delivery.
STEP 2 (Define key parameters)
- KPI entity is a shipment.
- KPI function is difference in days between date of arrival of shipment and date of its creating in CT2.
- KPI measure unit is a day.
- Key Date rule. Key events based on following dates:
- Created On Date.
- Actual Delivery Date (a.k.a. GenTab.y. Actual Delivery) from GenTab of CT.
- Rule: report should handle CTs with Delivery Date within Time Frame (see below) and calculate KPI function for them.
- "Group By" methods.
- Standard methods: all Time (days, weeks, months, quarters, years); carriers, consignees, shippers.
- Specific methods: planners.
- Filters.
- Standard filters: PO contains, SKU contains, Approved Date, Pick Up Date, Routed Date, Delivery Date, Carrier.
- Specific filters: Planner.
- Chart types.
- linear chart for every time grouping.
- bar chart for grouping by carriers, planners etc.
- Output fields.
- CT#.
- Load #.
- Created to Delivered (KPI column calculated as by formula Actual Delivery Date - Created On Date).
- Created On Date.
- Actual Delivery Date.
- Shipper.
- Consignee.
- Carrier.
- Pick Up Location.
- Delivery Location.
- Planner.
NOTE: need to define and add to list other KPI's which can be overlapped with current (depends from key entity).
- Default settings (in My Profile section).
- Time Frame: to be able select one from previous day/week/month/quarter/year.
- Group By: to be able select one from list included standard and specific "Group By" methods.
STEP 3 (Implementation parts)
- We should use Client Visibility Rules when showing KPI info
- Settings
Default values of KPI parameters should be set up in My Profile section.
- Date KPI panel settings should be added.
- We need ability to set up default values for parameters:
- "Time Frame"
- "Group By"
- Level 1
Initial KPI displaying.
- A table with 4 columns:
- Name of KPI,
- Time Frame range,
- KPI value (+ KPI measure, maybe in round brackets),
- Change (KPI changes from past Time Frame).
- Headers: Name, Time Frame, KPI, Change.
- "Created to Delivered" KPI on Level 1 (as well as Change) is average value for all shipments delivered per selected Time Frame:
- 1) calculate difference Delivered-Created for every shipment
- 2) get all days as amount of calculated differences
- 3) divide obtained sum by number of handled shipments
- Level 2
Chart displaying.
- First time opened chart should be look in correspondence with default settings:
- "Group By" and "Time Period" sections should be set in values specified in My Profile
- Chart type should be suitable for "Group by" value
- Filter Panel should be minimized and all filters are empty
- except Delivery Date filter displayed start ("from") and end ("to") dates of Time Frame range
- Selecting of new "Group By" or "Time Period" values refreshes the chart without additional confirm
- Changes on Filters Panel will update the chart after pressing of "Generate Result"
- Delivery Date filter after manual update should used instead "Time Period" for chart displaying
- Level 3
Spreadsheet displaying.
- 1) Click on "Download to Excel" button and get file
- OR
- 2) Activate by clicking on or chart (when it is bar type), define output fields, click on the button


