Client Statistics Report
From UG
(→SD: Filters) |
(→SD: Filters) |
||
| Line 299: | Line 299: | ||
* On the report template are filters to configure the report generation. See [[#Figure 1. Client Statistics Report Template | Figure 1]]. | * On the report template are filters to configure the report generation. See [[#Figure 1. Client Statistics Report Template | Figure 1]]. | ||
* List of filters: | * List of filters: | ||
| - | ** ''' | + | ** '''Time Frame''' - [[TBD]] |
| - | ** ''' | + | ** '''Transport Modes''' - located on the template as dropdown list, which include MOT = {Ocean LCL, Ocean FCL, Air, Truck}. |
| - | + | ||
** '''Clients''' - located on the template as dropdown list, which mapped from Client Companies. | ** '''Clients''' - located on the template as dropdown list, which mapped from Client Companies. | ||
** '''Shippers/Consignees''' - located on the template as client specific dropdown list, which include only shippers/consignees that are associated with clients. | ** '''Shippers/Consignees''' - located on the template as client specific dropdown list, which include only shippers/consignees that are associated with clients. | ||
| Line 309: | Line 308: | ||
*** [[CT_bo#Airport_Of_Departure]] / [[CT_bo#Airport_Of_Destination]] for Air CTs. | *** [[CT_bo#Airport_Of_Departure]] / [[CT_bo#Airport_Of_Destination]] for Air CTs. | ||
*** address info derived from [[CT_bo#Shipper_Address]] / [[CT_bo#Consignee_Address]] for Truck CTs. | *** address info derived from [[CT_bo#Shipper_Address]] / [[CT_bo#Consignee_Address]] for Truck CTs. | ||
| - | * | + | * All filters are "multi select", exclude "Time Frame". |
* Each filter has its own checkbox to the left of the name. If filter checkbox is checked, that means filter is set and affects the reports. If filter checkbox is not checked, that means filter is not set and does not affect the report. | * Each filter has its own checkbox to the left of the name. If filter checkbox is checked, that means filter is set and affects the reports. If filter checkbox is not checked, that means filter is not set and does not affect the report. | ||
** If a value of some filter is selected, then checkbox of this filter should be set to "checked" state automatically. | ** If a value of some filter is selected, then checkbox of this filter should be set to "checked" state automatically. | ||
Revision as of 19:23, 3 June 2010
Contents |
Info
CBN: Core Business Need
This wiki section is managed by: Module Owner
This report should help in defining the volume of shipments handled for specific Client Company (or group).
Low or medium or high volume will trigger certain business decision.
This report is related to Carrier Statistic Report
BR: Business Requirements and Design Ideas
This wiki section is managed by: Business Analyst
BR: Summary
For specific Client Company (or group) this report should help to answer these basic questions:
- FCL:
- How many containers with different types and sizes with TEU per month from each origin terminal to each destination terminal?
- LCL:
- How many CT shipments
- How much total of gross weight
- Total in cbm per month for each LCL shipment from each origin terminal to each destination terminal each month
- Air:
- How many CT shipments
- How much chargeable weight
- and average weight per month
- for each airline
- from origin terminal to destination terminal?
- for each airline
- Truck: How many CT shipments and how much total Gross weight per month for each trucking company from origin terminal to destination terminal?
BR: Details Per Mode
- Totals are per month based on Actual Collection Date
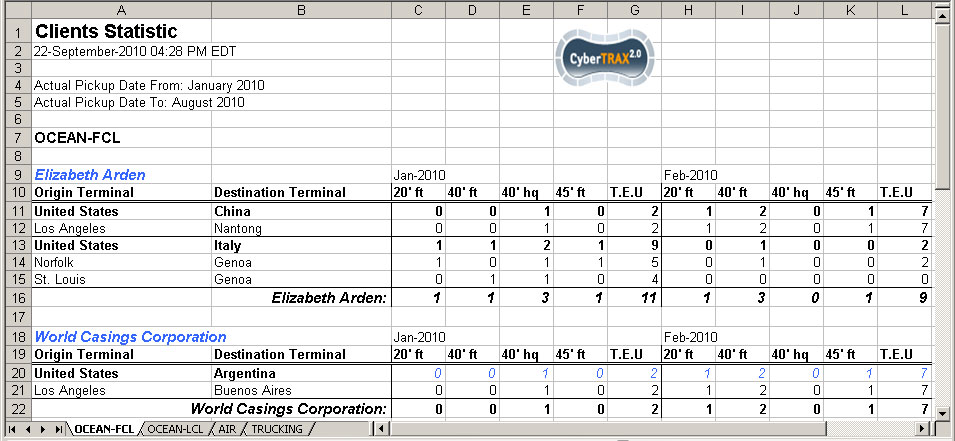
MOT = FCL
- Total containers with each combination between types and sizes listed below
- 20 ft (include all types)
- 40 ft (include all types except HQ)
- 40 hq (40 hq only)
- 45 ft (include all types)
- T.E.U (Twenty Equivalent Unit: 20 ft = 1 Equivalent)
- NOTE: 1 40 ft/hq or 45 ft = 2 T.E.U
- Total of each column
- Mapped to ContTab.size and ContTab.Type (15 cases to fit in 4 categories)
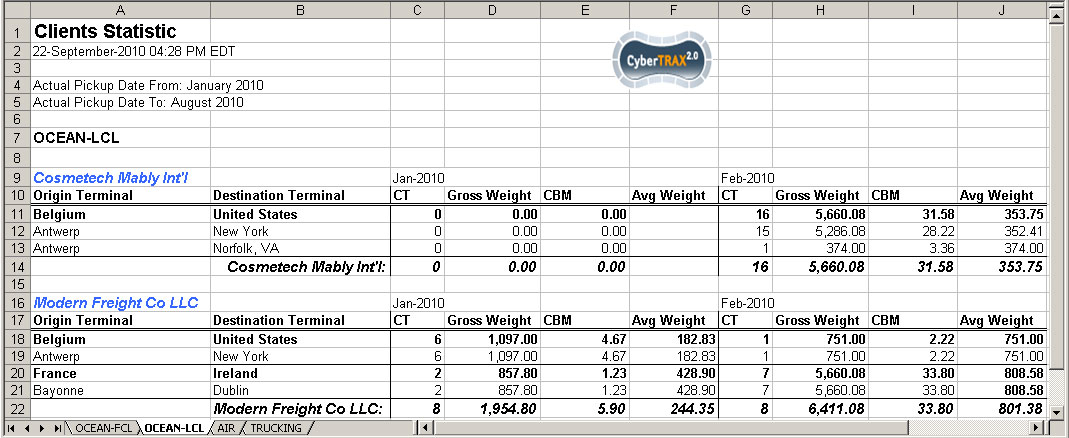
MOT = LCL
- Total CT shipments
- Total Gross weight
- Total in cbm
- Average weight
- Total of weight/number of CT shipments
- Total of each column
- Mapped to ContTab.Table A. GrandTotal.Ttl G kg (2 decimal places)
- Mapped to ContTab.Table B. Total (in cbm)
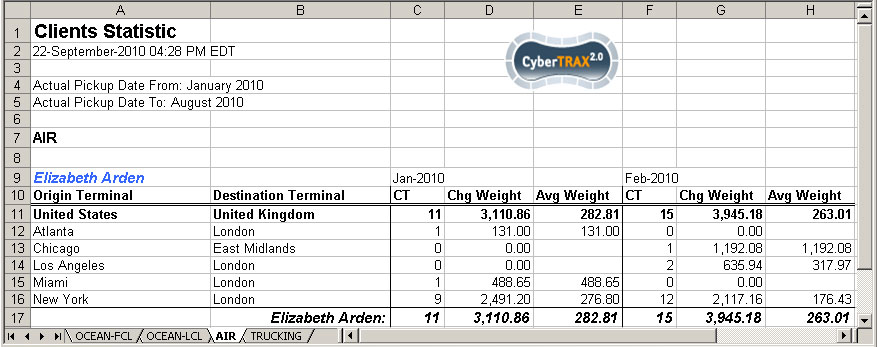
MOT = AIR
- Total CT shipments
- Total chargeable weight
- Average weight
- Total of weight/number of CT shipments
- Total of each column
- Mapped to ExpTab.17b: Chargeable weight
MOT = Truck
- Total CT shipments
- Total Gross weight
- Average weight
- Total of weight/number of CT shipments
- Total of each column
- Mapped to ContTab.Table A. GrandTotal.Ttl G kg
BR: Output
- spreadsheet only
- Spreadsheet tabs: one tab per mode
- Spreadsheet consists of Header, Body, and footer
- Header:
- Report name
- Date time stamp
- Criteria(list of filters selected)
- Jaguar Logo
- Body:(general info)
- consists of sections: separately by from country to country
- Each section label from country -> country
- In case there is sub-section, list subsection such as Airline,...etc
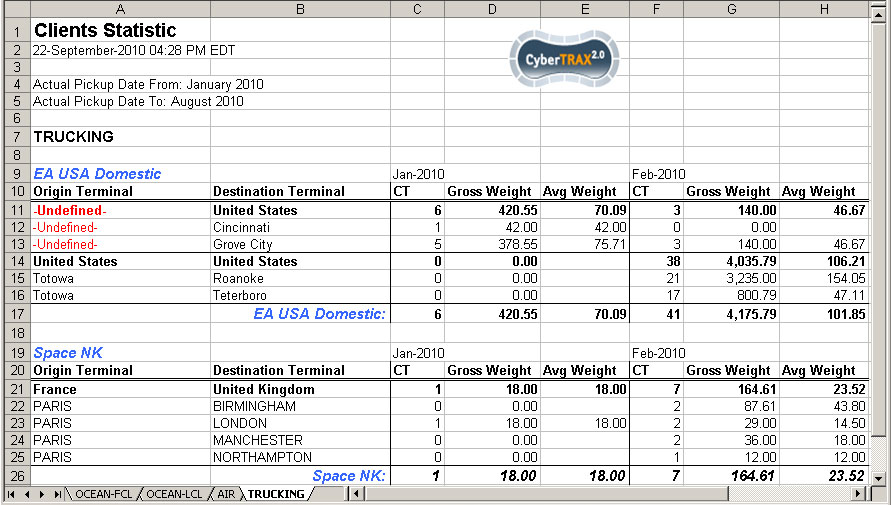
- Figure 1: refer an example of one section
- Many sections should be separated by one row
- Table consists of columns. See Columns Definitions below
- Footer:
- There is no footer
BR: Columns Definitions
'MOT: FCL
Origin Terminal
- location that shipment is moved from (port)
Destination Terminal
- location that shipment is moved to (port)
Month
- Report by monthly (Jan - Dec); depend on Month filter is selected
20'ft
- summary count() for that particular size and types: See #Hard Coded Conditions
40'ft
- summary count() for that particular size and types: See #Hard Coded Conditions
40'hq
- summary count() for that particular size and types: See #Hard Coded Conditions
T.E.U
- summary calculation for that particular size and types: See #Hard Coded Conditions
Total with label (country -> country)
- sum up result per column per "location country from" to "location country to"
MOT: LCL
Origin Terminal
- location that shipment is moved from (port)
Destination Terminal
- location that shipment is moved to (port)
Month
- Report by monthly (Jan - Dec); depend on Month filter is selected
CT
- summary shipments count()
Gross weight
- summary gross weight count()
cbm
- summary cbm count()
Avg weight
- summary calculation: Total of gross weight/number of CT shipments count()
Total with label (country -> country)
- sum up result per column per location country from to location country to
MOT: AIR
Origin Terminal
- location that shipment is moved from (port)
Destination Terminal
- location that shipment is moved to (port)
Month
- Report by monthly (Jan - Dec); depend on Month filter is selected
Airline (make it Italic & blue)
- Airlines that moves shipment from one location to the other location within from (port) to (port) country
CT
- summary shipments count()
Chg weight
- summary chargeable weight count()
Avg weight
- summary calculation: Total of chargeable weight/number of CT shipments count()
Total (make it Italic)
- sum up result per column for each airline
Total with label (country -> country)
- sum up result per column per location country from to location country to
MOT: TRUCK
Origin Terminal
- location that shipment is moved from (port)
Destination Terminal
- location that shipment is moved to (port)
Month
- Report by monthly (Jan - Dec); depend on Month filter is selected
CT
- summary shipments count()
Gross weight
- summary gross weight count()
Avg weight
- summary calculation: Total of gross weight/number of CT shipments count()
Total
- sum up result per column per location country from to location country to
BR: Figures
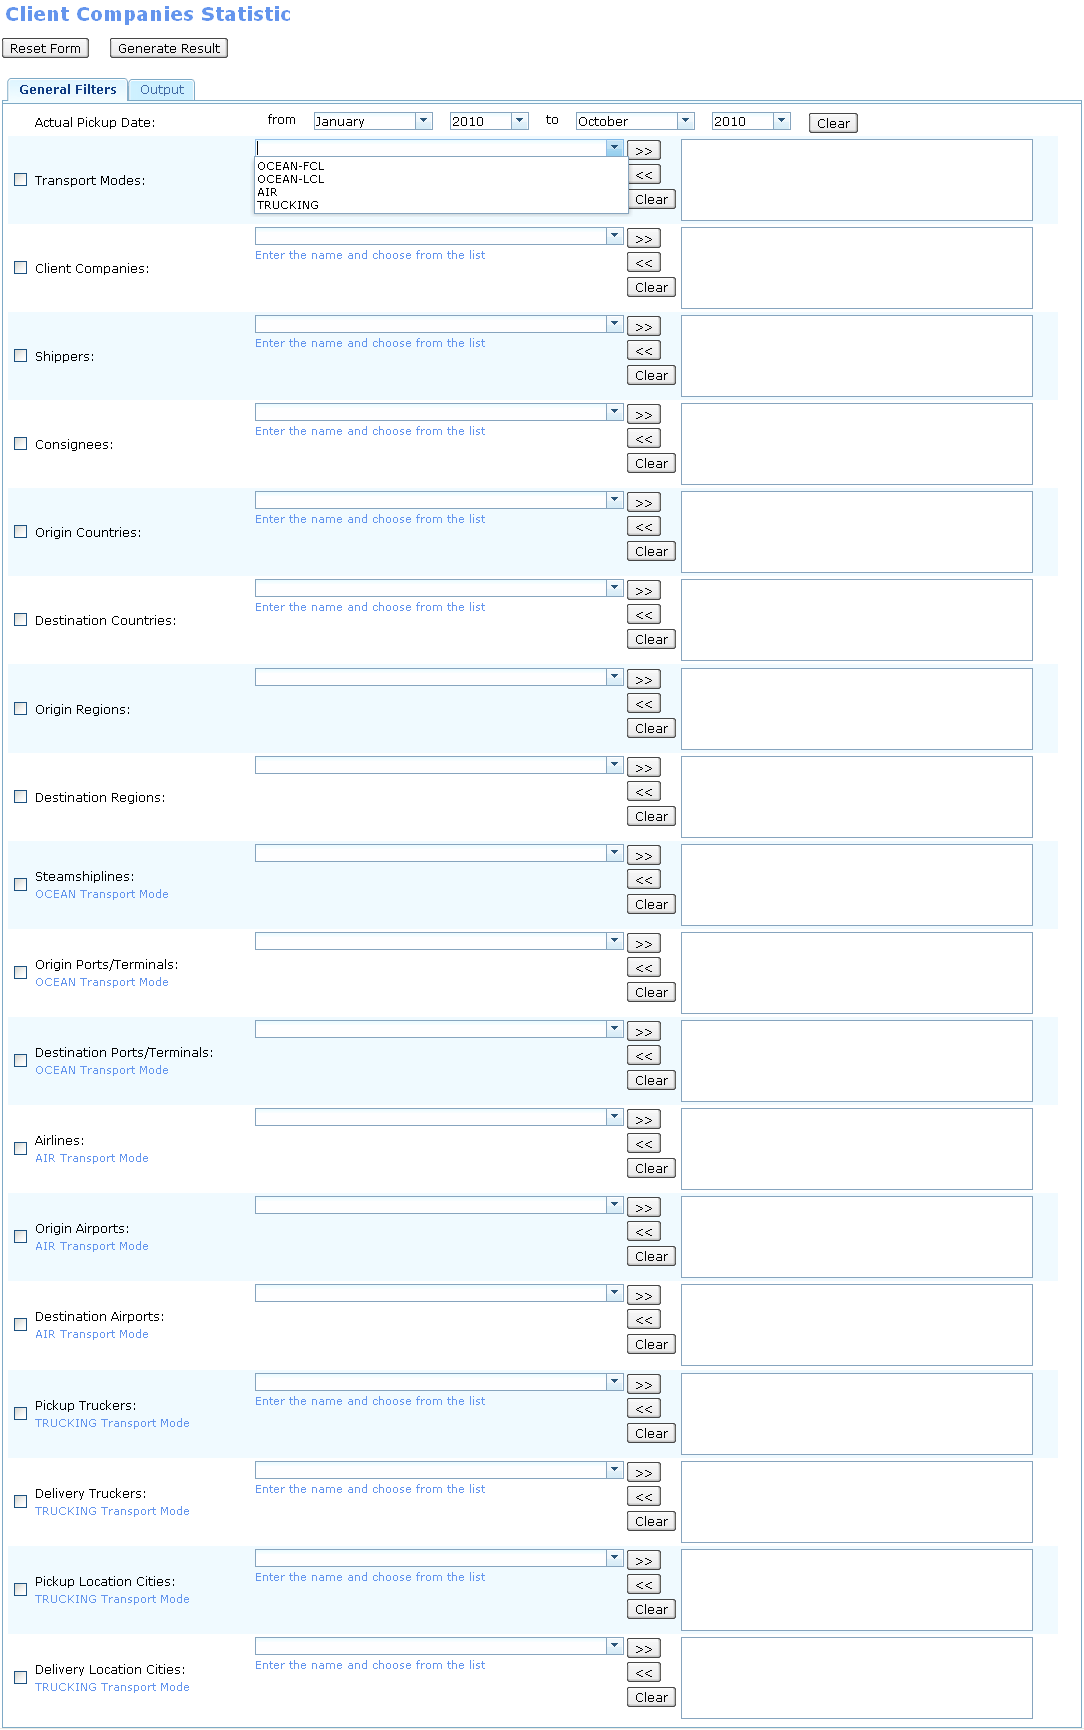
Figure 0. Filters
Figure 1. Mode FCL
Figure 2. Mode LCL
Figure 3. Mode Air
Figure 4. Mode Truck
SD: Systems Design
This wiki section is managed by: Systems Analyst
SD: Summary
This report is one of a family of statistics reports. It is related to Carrier Statistic Report.
Client Statistics Report is available from the main menu on the next path: "Reports -> Statistical -> Client Statistics". See Figure 0.
Client Statistics Report should help to answer these basic questions for specific Client Company:
- FCL:
- How many containers with different types and sizes with TEU per month from each origin terminal to each destination terminal?
- LCL:
- How many CT shipments
- How much total of gross weight
- Total in cbm per month for each LCL shipment from each origin terminal to each destination terminal each month
- Air:
- How many CT shipments
- How much chargeable weight
- and average weight per month
- for each airline
- from origin terminal to destination terminal?
- for each airline
- Truck: How many CT shipments and how much total Gross weight per month for each trucking company from origin terminal to destination terminal?
SD: Details Per Mode
Report should be contain monthly information for one or several Client Companies for a specified period.
Information that should be reflected in the report is grouped by MOT( Mode Of Transport) and shows shipment totals from each Origin Terminal to each Destination Terminal, which in turn are grouped and summed by Country.
MOT = FCL
- Total containers with each combination between types and sizes listed below. Mapped to ContTab.Size and ContTab.Type (15 cases to fit in 4 categories):
- 20 ft (include all types)
- 40 ft (include all types except HQ)
- 40 hq (40 hq only)
- 45 ft (include all types)
- T.E.U ( Twenty Equivalent Unit: 20 ft = 1 TEU) for each type from above.
- NOTE: one 40 ft/hq or 45 ft = 2 TEU
- Total of each column
Example 1. Mode FCL
MOT = LCL
- Total CT shipments
- Total Gross weight. Mapped to ContTab.Table A. GrandTotal.Ttl GW kg (2 decimal places).
- Total in cbm. Mapped to ContTab.Table B. Total (in cbm).
- Average weight. Calculated by formula: Total Gross weight / Total CT shipments.
- Total of each column
Example 2. Mode LCL
MOT = AIR
NOTE: for this Transport Mode there is also grouping by Airlines
- Total CT shipments
- Total chargeable weight. Mapped to ExpTab.17b: Chargeable weight.
- Average weight. Calculated by formula: Total chargeable weight / Total CT shipments.
- Total of each column
Example 3. Mode Air
MOT = Truck
- Total CT shipments
- Total Gross weight. Mapped to ContTab.Table A. GrandTotal.Ttl GW kg.
- Average weight. Calculated by formula: Total Gross weight / Total CT shipments.
- Total of each column
Example 4. Mode Truck
Totals
Totals are per month based on Actual Collection Date:
- Actual Collection Date for MOT = {OCEAN - FCL, Trucking-Ocean}.
- Actual Export Pick-Up Date for MOT = {OCEAN - LCL, AIR, Trucking-Domestic, Trucking-Air}.
This means that all totals of report should be calculated on the basis of dates from above.
- In other words, to add a some CT totals to the report for any month, Actual Collection Date of CT should be in range of this month.
SD: Filters
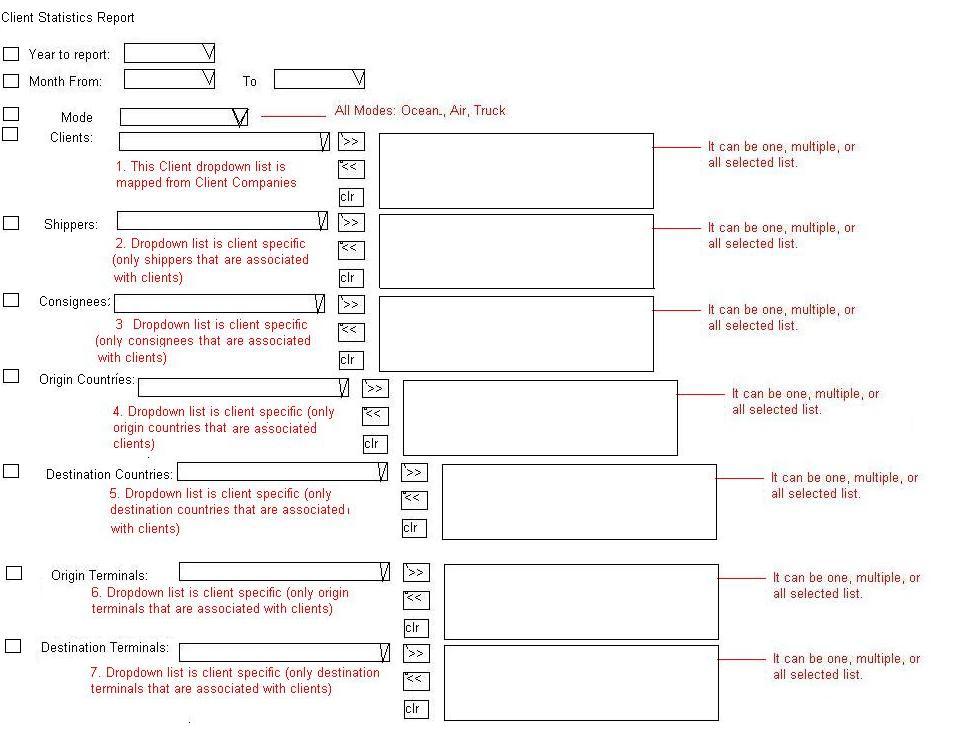
- On the report template are filters to configure the report generation. See Figure 1.
- List of filters:
- Time Frame - TBD
- Transport Modes - located on the template as dropdown list, which include MOT = {Ocean LCL, Ocean FCL, Air, Truck}.
- Clients - located on the template as dropdown list, which mapped from Client Companies.
- Shippers/Consignees - located on the template as client specific dropdown list, which include only shippers/consignees that are associated with clients.
- Origin/Destination Countries - located on the template as client specific dropdown lists, which include only countries that are associated with clients. Mapped to Admin->Geography->Countries.
- Origin/Destination Terminals - located on the template as client specific dropdown lists, which include only terminals that are associated with clients. Mapped to:
- CT_bo#Origin_Terminal / CT_bo#Destination_Terminal for Ocean CTs.
- CT_bo#Airport_Of_Departure / CT_bo#Airport_Of_Destination for Air CTs.
- address info derived from CT_bo#Shipper_Address / CT_bo#Consignee_Address for Truck CTs.
- All filters are "multi select", exclude "Time Frame".
- Each filter has its own checkbox to the left of the name. If filter checkbox is checked, that means filter is set and affects the reports. If filter checkbox is not checked, that means filter is not set and does not affect the report.
- If a value of some filter is selected, then checkbox of this filter should be set to "checked" state automatically.
- If all values of some filter are cleared, then checkbox of this filter should be set to "unchecked" state automatically.
- If no filter value is selected, that means "all". For example, if Mode filter is blank (and checked!), then report will include info by all its modes.
- Every filter is connected by AND and sub selections inside each filter combo-box are connected by OR.
- For example: (Year to Report = 2009) AND (Mode = Ocean OR Mode = Air) AND (Shipper = EUROSTOCK OR Shipper = VALOIS)
SD: Output
- Output form of this report is carried out only in spreadsheet (HTML form is not required).
- Output spreadsheet contains information divided by tabs, each of which corresponds to one selected MOT from the "Transport Modes" filter on template.
- For details, see #BR: Output.
- For every MOT there is a set of columns that should be shown. See #BR: Columns Definitions.
- Examples of layouts for the report output shown in #BR: Figures:
SD: Figures
Figure 0. Main Menu item
Figure 1. Client Statistics Report Template
History
m1511
last revision with BR - http://mantis.jaguarfreight.com/mediawiki-1.15.0/index.php?title=Client_Statistics_Report&oldid=11112
last revision - http://mantis.jaguarfreight.com/mediawiki-1.15.0/index.php?title=Client_Statistics_Report&oldid=11114
